
The page
Step 10 reads from top to bottom: the scenario, six key figures, the consistency checks, the calculation warnings, then the statements in their tabs.
The scenario
The Scenario selector offers Cautious, Central and Optimistic. Central is the engagement as you entered it. The other two recalculate it under their variations (volume, price, costs…), set in KPIs and report (chapter 11). The chosen scenario is written into the page address: a copied link reopens the same scenario on the same tab.
The six key figures
| Figure | What it tells you |
|---|---|
| Revenue A1 and Revenue of the last year | The ramp-up |
| EBITDA of the last year | What operations generate at the horizon |
| Cumulative net profit | The sum of the plan's profits |
| Lowest cash balance | The lowest point, and its year |
| Lowest DSCR | The weakest debt coverage, its year and its threshold; “No debt to service” without a loan |
A negative EBITDA, profit or cash balance turns red, as does a DSCR below its threshold.
The consistency checks
The balance sheet is never forced to balance: its balance is a check. The Consistency checks card verifies five:
| Check | What it verifies |
|---|---|
| Assets = liabilities | The balance sheet balances every year. |
| Cash: direct plan = cash flow statement | The cash plan matches the cash flow statement. |
| Debt schedules | Each schedule repays exactly the principal borrowed. |
| Depreciation | No asset is depreciated beyond its value. |
| Initial financing plan: uses = sources | Start-up sources cover the uses exactly, within the tolerance: a surplus also fails. |
All satisfied: “All checks pass: the statements hold together.” A failed check turns red and states its cause, for example: “The opening position does not balance (difference …): complete it (assets = liabilities) — the difference carries over to every year.”
The calculation warnings
Below the checks, Calculation warnings lists what the calculation had to assume, with a Fix in “…” link to the page where it is corrected:
- a sales line with missing values: its revenue is zero in those years;
- a loan with no term: it is never repaid in the plan;
- an asset with no depreciation period: the period of its category is used.
The eight tabs
| Tab | What it shows |
|---|---|
| Income statement | From revenue to net profit, on the financial-statement template; staff costs broken down into Salaries and Social security charges. |
| Balance sheet | Assets, equity and liabilities at year end, on the same template. |
| Cash flows | The cash flow statement, indirect method: from profit to the change in cash. |
| Cash plan | Direct method: the receipts and payments of each year. |
| Working capital | Inventory and receivables, less operating payables, at year end. |
| Depreciation | One asset per line: base, period, charges; the total is the income statement's, opening fixed assets included. |
| Debt | Each scheduled debt: interest, principal repayment, principal outstanding. Permanent funding without a schedule appears in the balance sheet liabilities. |
| Financing plan | The multi-year plan: uses and sources of each year; their balance is the change in cash. The initial plan is read in Financing. |
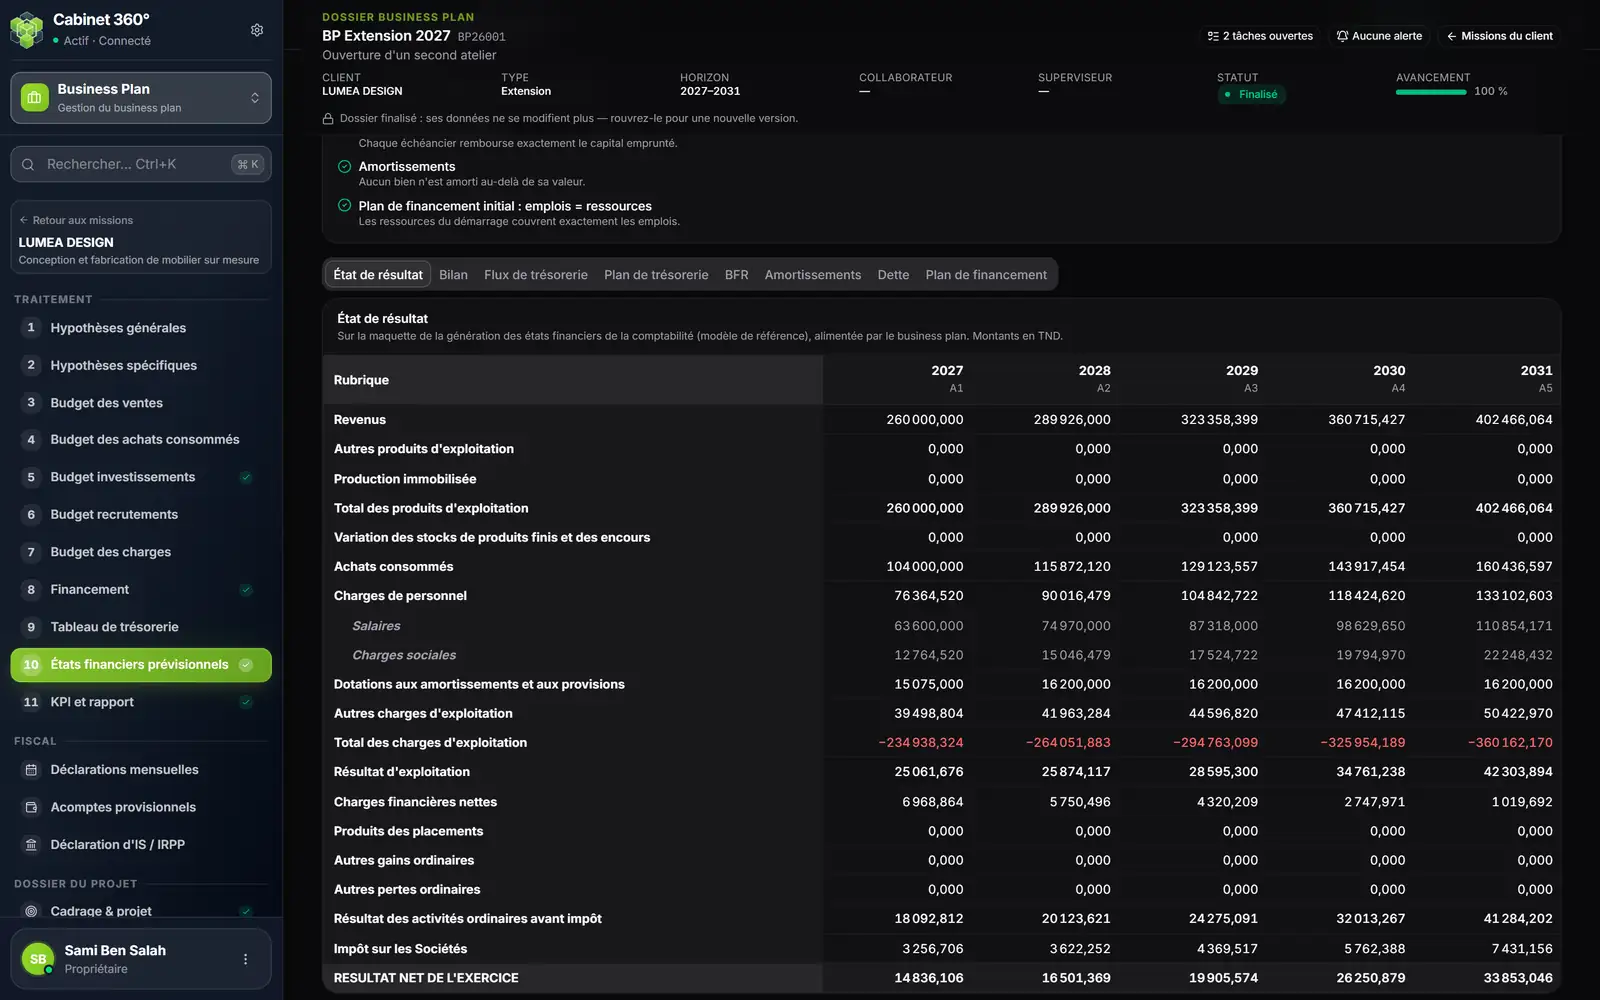
- 1. The checks: each one ticked when it is satisfied.
- 2. Eight tabs: from the income statement to the financing plan.
- 3. The template of the accounting financial statements, fed by the business plan.
- 4. One item per line, one column per year.
- 5. Salaries and social charges break down staff costs.
- 6. A negative amount keeps its minus sign, in red.
- 7. Net profit for each year.
The first three tabs follow the lines, the order and the formulas of the accounting module's reference financial-statement model. A business plan thus reads like the statements the firm produces every year for its clients.
The calculation conventions
At the bottom of the page, Calculation conventions recalls how to read the figures, including:
- years are calendar years, from A1 to the last; the first only counts its months of activity, pro rata;
- amounts exclude VAT: VAT on investments is neutral when it is recoverable;
- a negative cash balance appears in liabilities as bank overdrafts; its interest is charged on the overdraft at the end of the previous year;
- a year's dividends are taken from the previous year's profit, never beyond the distributable profit;
- the balance sheet is never forced to balance: assets = liabilities is a check, as is the match between the cash plan and the cash flow statement.
The calculation date is written below: “Computed on …”.
Export to Excel
Export (Excel) produces a workbook of the calculation's statements: income statement, balance sheet assets, balance sheet liabilities, cash flows, cash plan, working capital and financing plan, one sheet each, then depreciation and debt. These are the calculation's tables, not the accounting template of the first three tabs: their lines differ. An expense is written as a negative there, so that a column adds up.