
The page
Step 11 has two tabs: KPIs (ratios & sensitivity) and Final report. This chapter follows the first; the second is in chapter 12.
The KPI tab has four sub-tabs: Ratios, Scenarios, Price × volume matrix and Break-even points. The Scenario selector, at the top right, chooses the scenario of the ratios.
Ratios
The project indicators
Four tiles open the page:
| Indicator | What it tells you |
|---|---|
| NPV | The net present value of the horizon's free cash flows, residual value included, at the discount rate of the assumptions. |
| IRR | The project's internal rate of return. |
| Payback period | The number of years needed to recover the initial investment. |
| Lowest DSCR | The weakest debt coverage, and its year. |
The Project profitability card judges the NPV, the IRR and the payback period: Compliant, Outside threshold, or Not assessed when no threshold is set or the value cannot be computed. It details the calculation: discount rate, initial investment, residual value (net fixed assets and working capital of the last year), and the flows of each year.
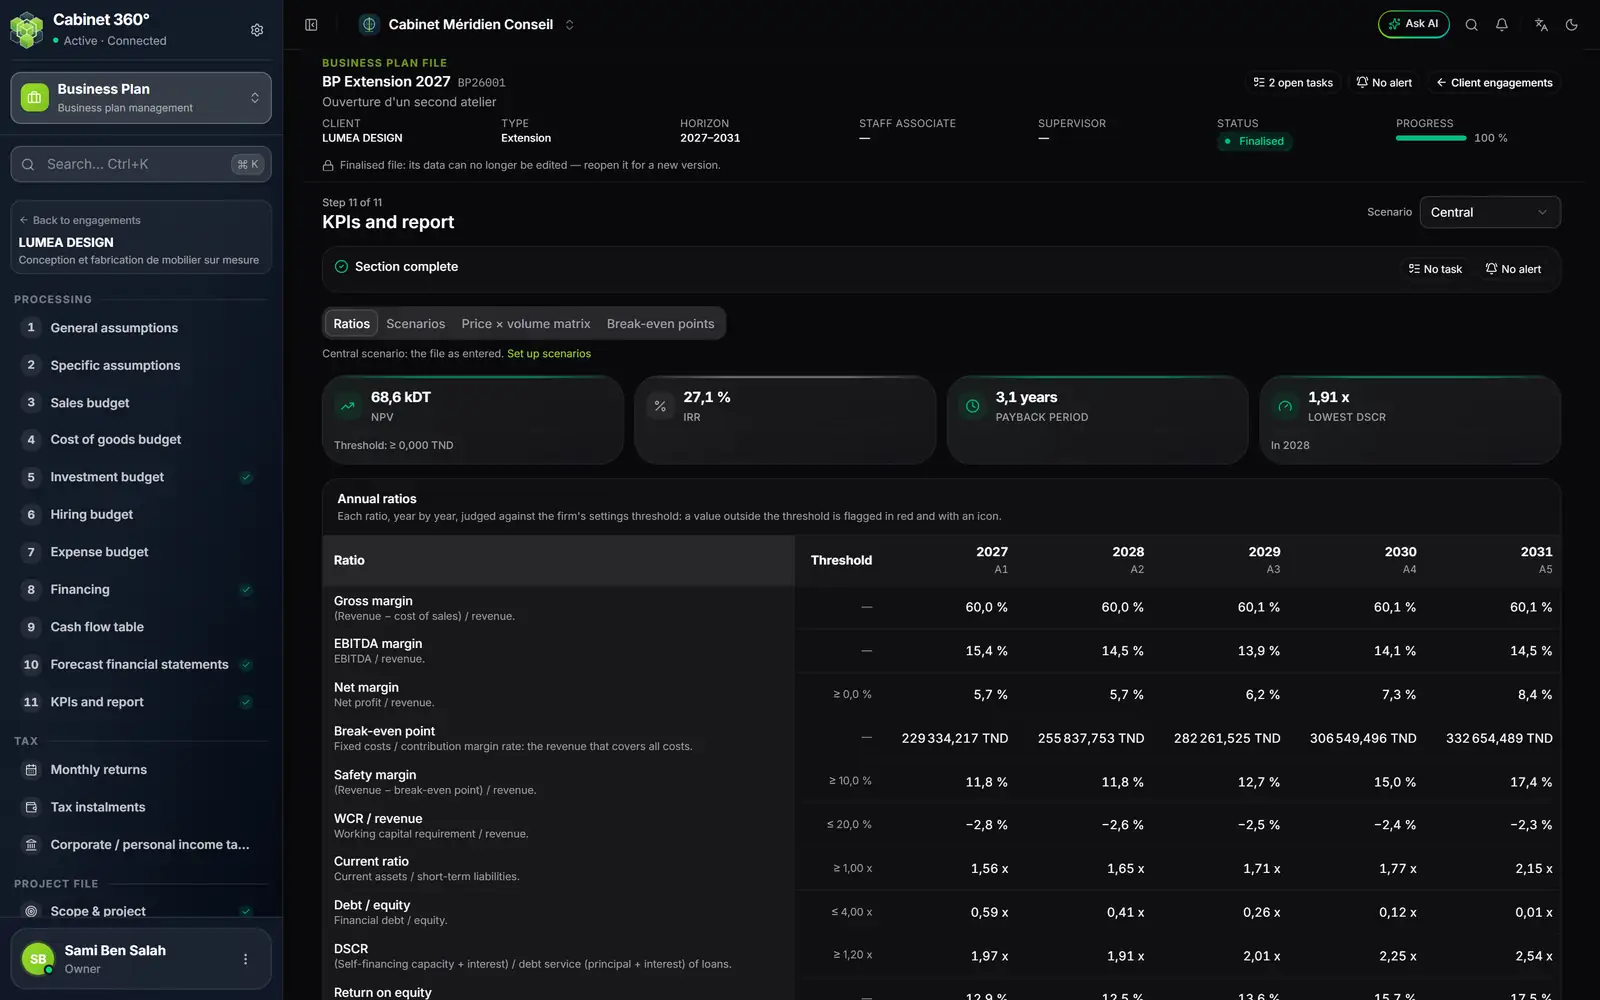
- 1. The scenario of the ratios: Central, Cautious or Optimistic.
- 2. Four sub-tabs: Ratios, Scenarios, Price × volume matrix, Break-even points.
- 3. The project indicators: NPV, IRR, payback period, lowest DSCR.
- 4. The threshold of each ratio, with its direction: at least or at most.
- 5. Break-even point: the revenue that covers all expenses.
- 6. DSCR: the capacity to service the debt, year by year.
The annual ratios
Each ratio, year by year, with its definition and its Threshold. The page lists them one by one; this table groups them by what they measure:
| What they measure | Ratios |
|---|---|
| Profitability | Gross margin · EBITDA margin · Net margin · Return on equity · Return on capital employed |
| Activity | Break-even point · Safety margin · WCR / revenue |
| Soundness | Current ratio · Debt / equity · Financial autonomy |
| Debt | DSCR · Repayment capacity · Interest coverage |
A value outside the threshold is written in red, with an icon. A “—” means a ratio has no base that year; hover over it to read why. A missing value is never 0.
The break-even point
The Break-even point is the revenue that covers all expenses: fixed costs ÷ contribution margin rate. The Safety margin says by how much revenue exceeds this threshold: (revenue − break-even point) ÷ revenue. A safety margin of 12 % means the project stays profitable as long as its sales do not fall by more than 12 %.
Scenarios
Scenario comparison puts the three side by side. Each scenario is the whole engagement recalculated: lower volume reduces revenue, working capital and cash, and the DSCR follows.
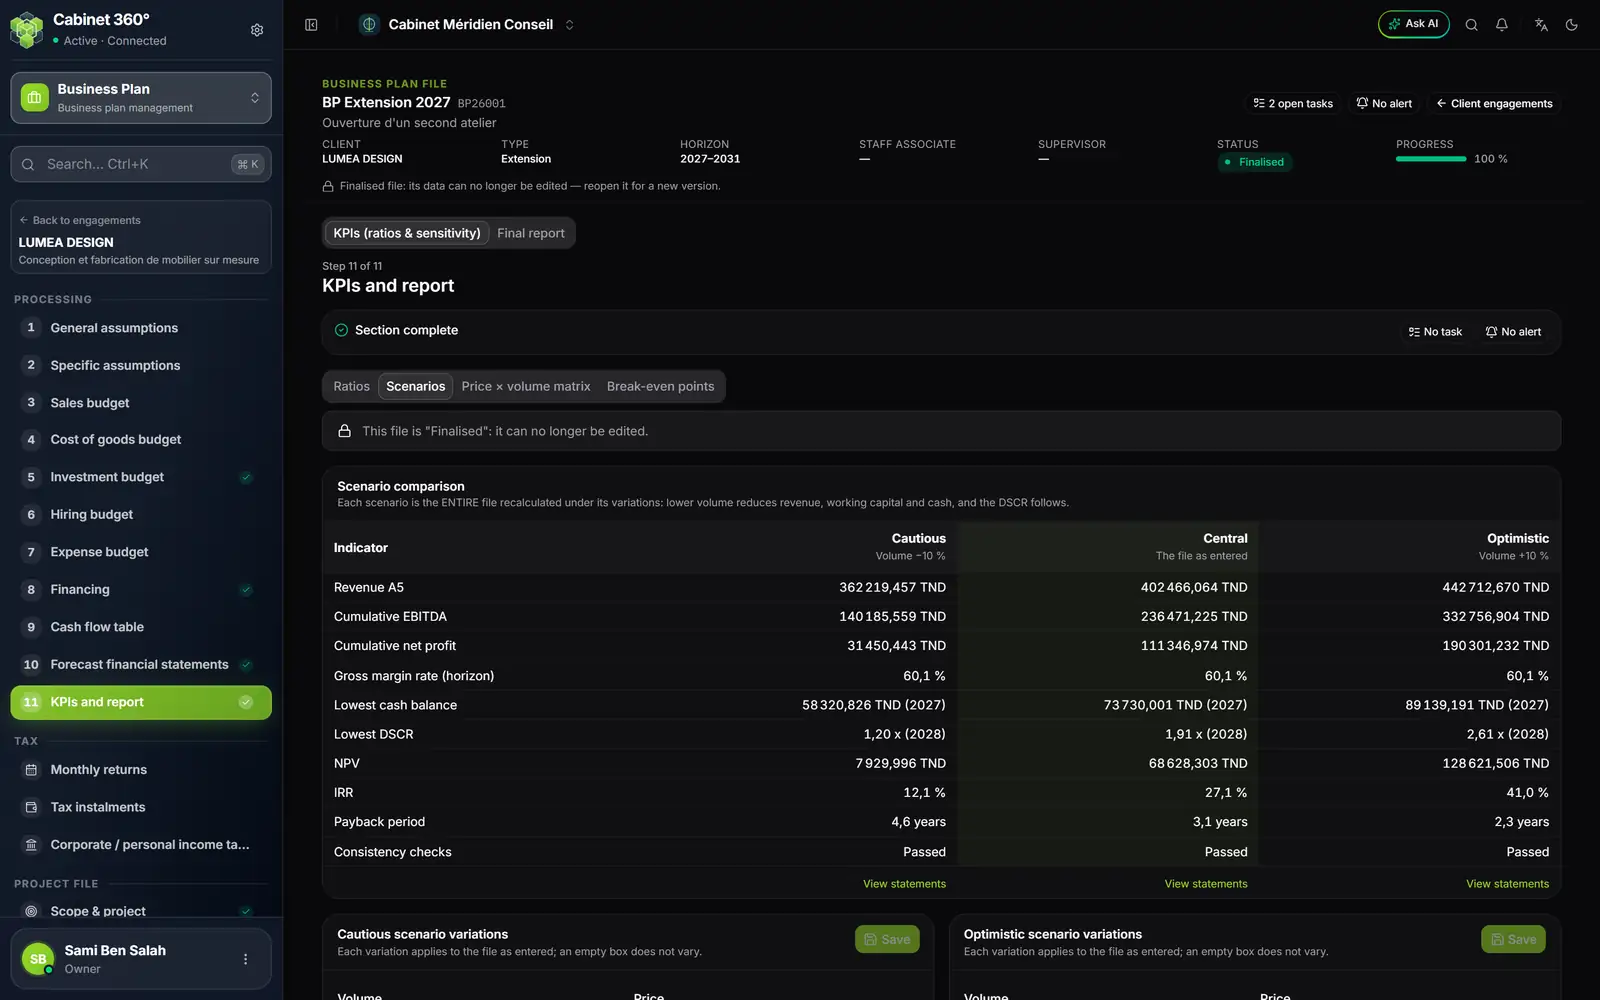
- 1. Cautious: the engagement recalculated under its variations (here, volume −10 %).
- 2. Central: the engagement as entered.
- 3. Optimistic: volume +10 %.
- 4. Ten indicators: revenue, EBITDA, profit, margin, cash, DSCR, NPV, IRR, payback, checks.
- 5. View statements of a scenario.
- 6. The variations of Cautious and Optimistic, to be set.
Setting a scenario
Below the comparison, Cautious scenario variations and Optimistic scenario variations can be set:
| Variation | Unit |
|---|---|
| Volume, Price, Material cost, Salaries, Capital expenditure | % |
| Customer payment terms, Supplier payment terms | days |
| Interest rate | points |
Enter for example “-10” on the volume of Cautious, then click Save. An empty box does not vary. A payment term cannot vary by more than 365 days; a drop of 100 % or more is refused. Central is not set here: it is the engagement as entered, and it is corrected in the steps.
A new engagement receives the default variations held by IntegraSys; they can then be corrected for that engagement alone.
Price × volume matrix
The matrix shows one indicator under each pair of volume variations (in rows) and price variations (in columns), the whole engagement recalculated for each cell. Choose the Indicator: NPV, Cumulative net profit, Cumulative EBITDA, Lowest cash balance or Lowest DSCR. The centre cell is the engagement as entered. The colours say Positive or Negative; for the DSCR, At or above threshold or Below threshold.
Break-even points
For each variable (volume, price, material cost, customer payment terms) applied alone, the page finds the variation that brings each indicator to its break-even point: NPV at zero, Cash never negative, DSCR at threshold.
“−18,4 %” on volume reads: volume can fall by 18,4 % before the indicator reaches its break-even point. Below the variation, the horizon's gross margin at that point: the minimum margin level the project can bear. Out of range, the cell says why: “Holds even at … %”, “Not reached, even at … %”, “No debt”.