
Opening the dashboard
The Operations Dashboard is the first page of the module. It requires the Dashboards right, which the owner or an administrator grants in your role. Without it, the page says so and shows no figures.
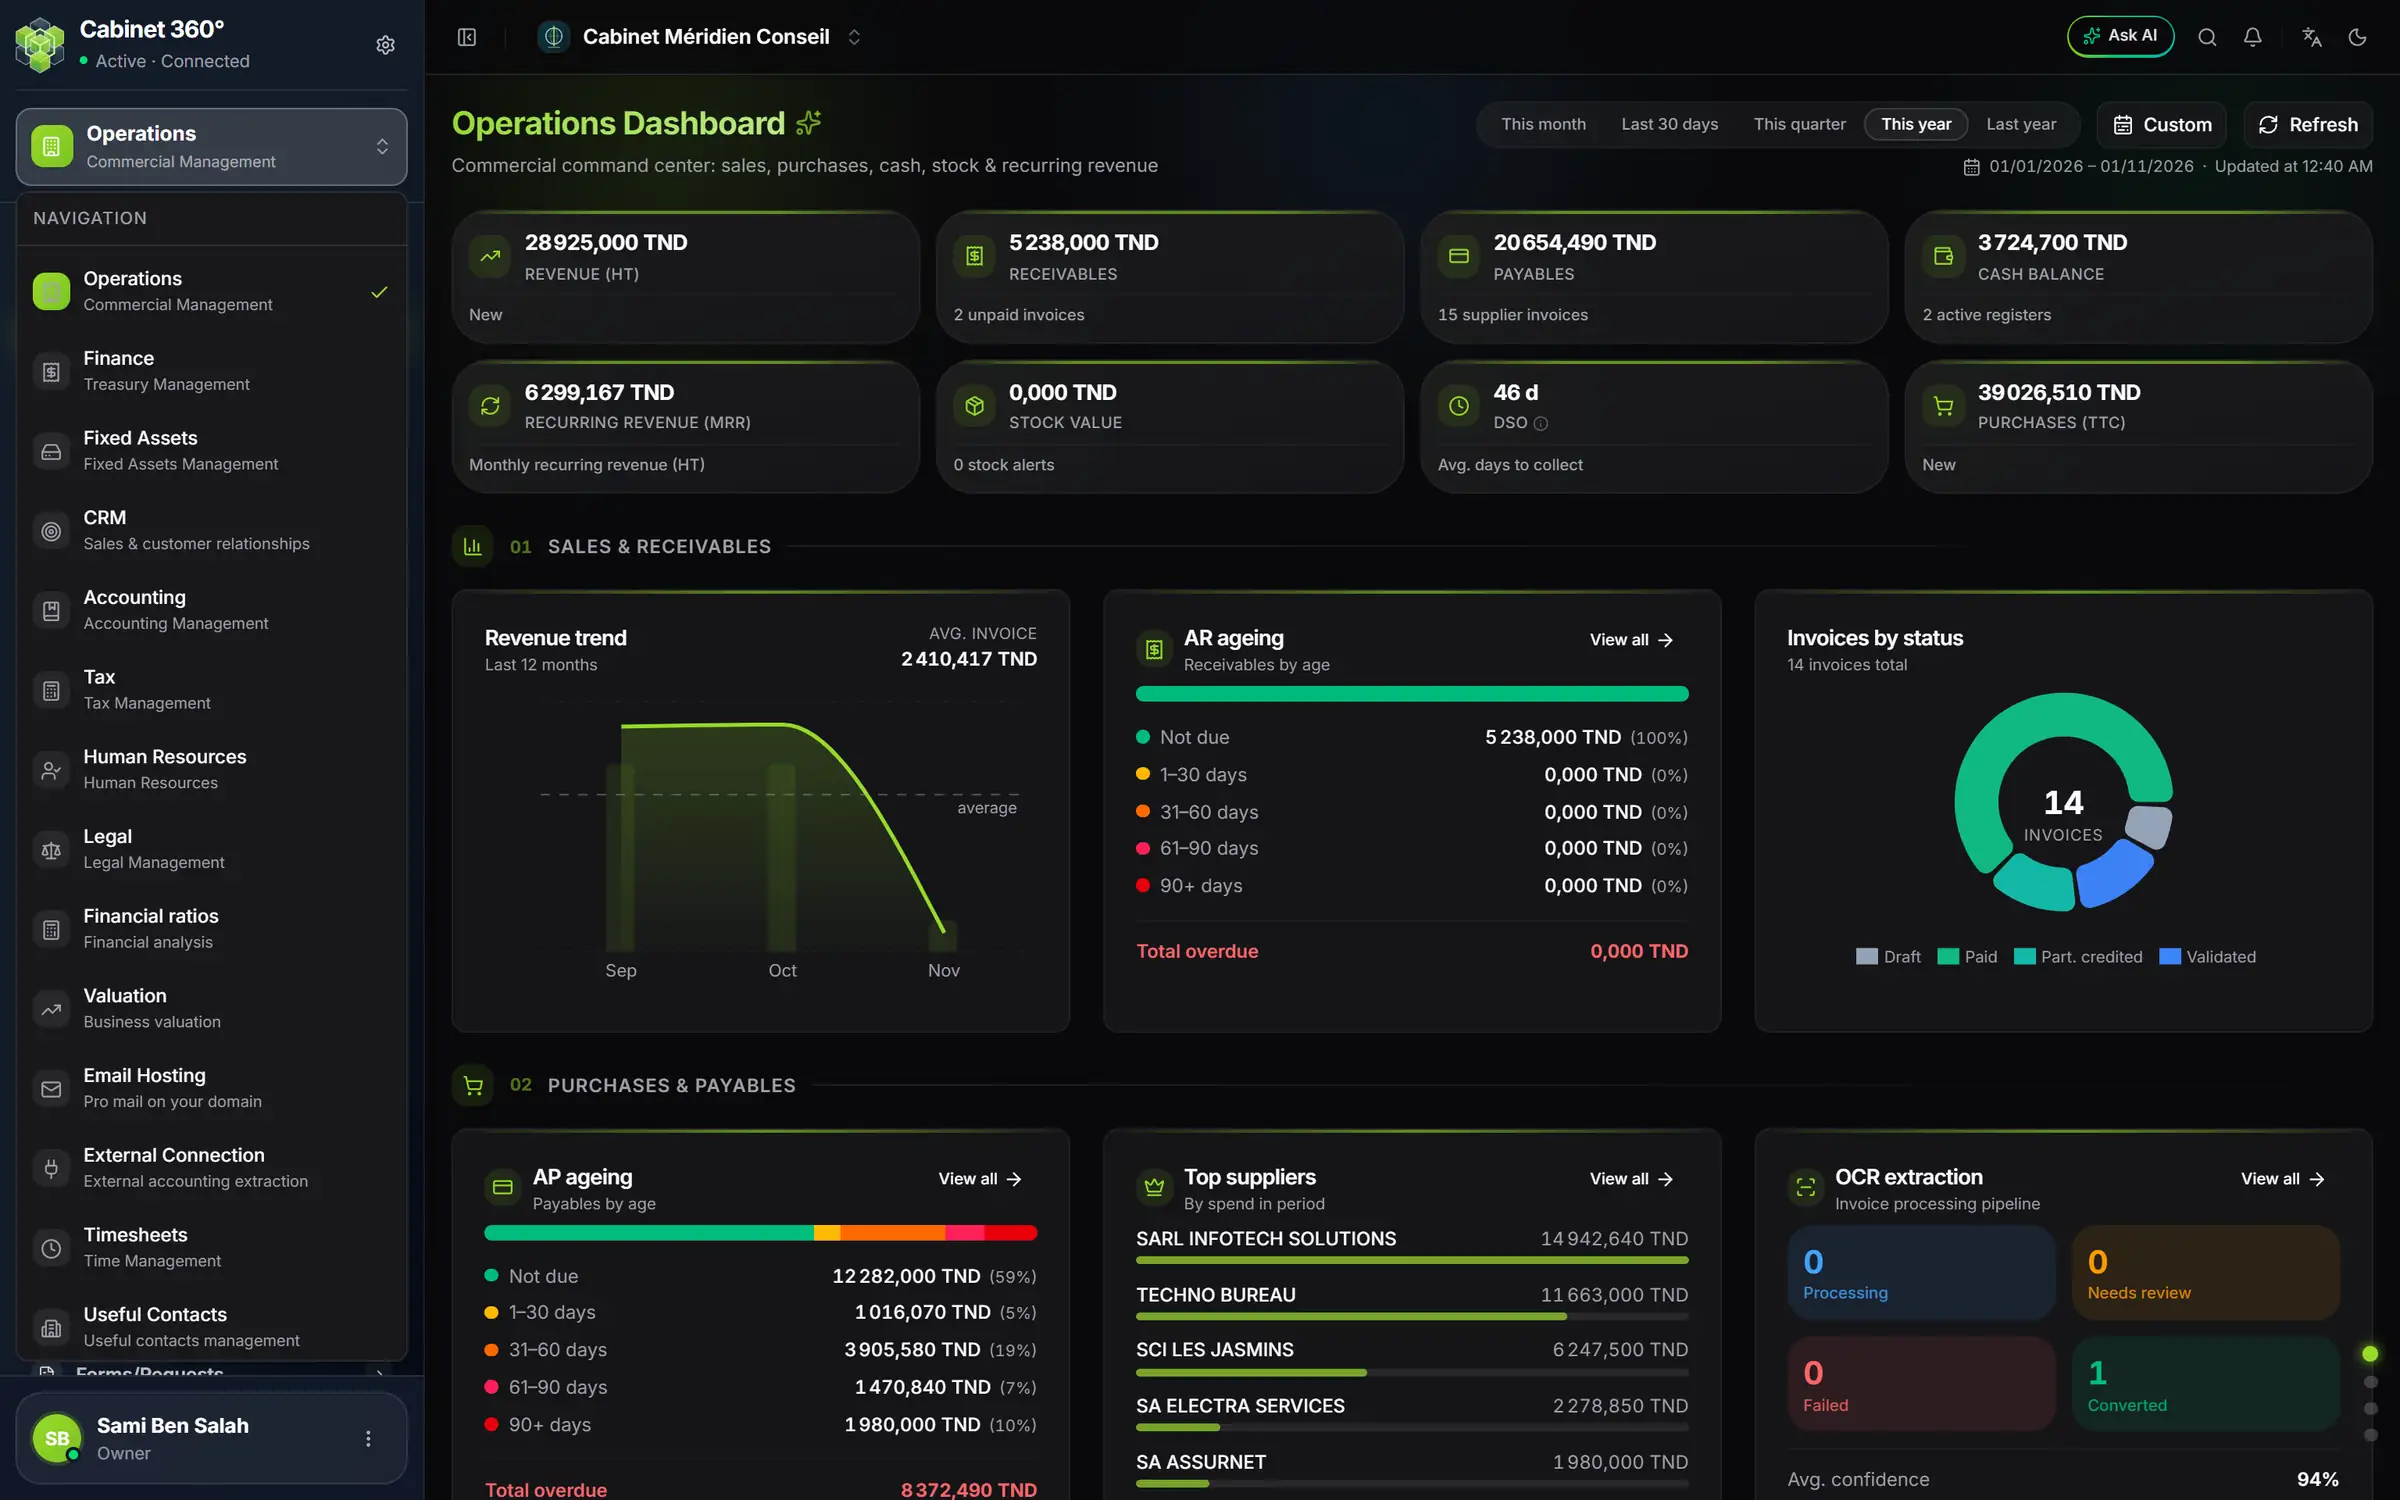
- 1. The period: This month, Last 30 days, This quarter, This year, Last year.
- 2. Custom: your own dates, from… to…
- 3. Refresh reloads the figures.
- 4. The eight indicators: one click opens the screen that details them.
- 5. 01 Sales & receivables, then 02 Purchases & payables further down.
- 6. Invoices by status: the breakdown of your invoices.
Choosing the period
At the top right, choose the reporting window: This month, Last 30 days, This quarter, This year (the choice on opening) or Last year. The Custom button opens two dates, From and To: click Apply.
Under the buttons, the page recalls the dates of the period and the time of the last refresh.
The eight indicators
| Indicator | What it counts | One click opens |
|---|---|---|
| Revenue (HT) | Your invoices issued over the period, excluding taxes, minus validated credit notes | Invoices |
| Receivables | What your clients still owe you, with the number of unpaid invoices | Invoices |
| Payables | What you still owe on your purchase invoices that are not archived, drafts included | Purchase Invoices |
| Cash balance | The balance of your active cash registers | Cash Register |
| Recurring revenue (MRR) | The monthly revenue, excluding taxes, of your conventions and domiciliations | Conventions |
| Stock value | The value of the articles tracked in stock, with the alerts | Stock |
| DSO | The average collection time, in days | Invoices |
| Purchases (TTC) | Your purchase invoices for the period, all taxes included, drafts included | Purchase Invoices |
Under revenue and purchases, a small line compares with the previous period (“vs prev.”).
The four sections
The page reads from top to bottom, in four sections. On a very large screen, a column of dots on the right edge takes you straight to each one.
01 Sales & receivables
- Revenue trend: the last 12 months and, next to it, the average invoice of the chosen period.
- AR ageing: your receivables by age, from Not due to 90+ days, and the Total overdue.
- Invoices by status: the breakdown of your invoices.
02 Purchases & payables
- AP ageing: your payables by age.
- Top suppliers: by spend over the period.
- OCR extraction: the purchase invoices read by the AI, Processing, Needs review, Failed, Converted, and the average confidence.
03 Treasury
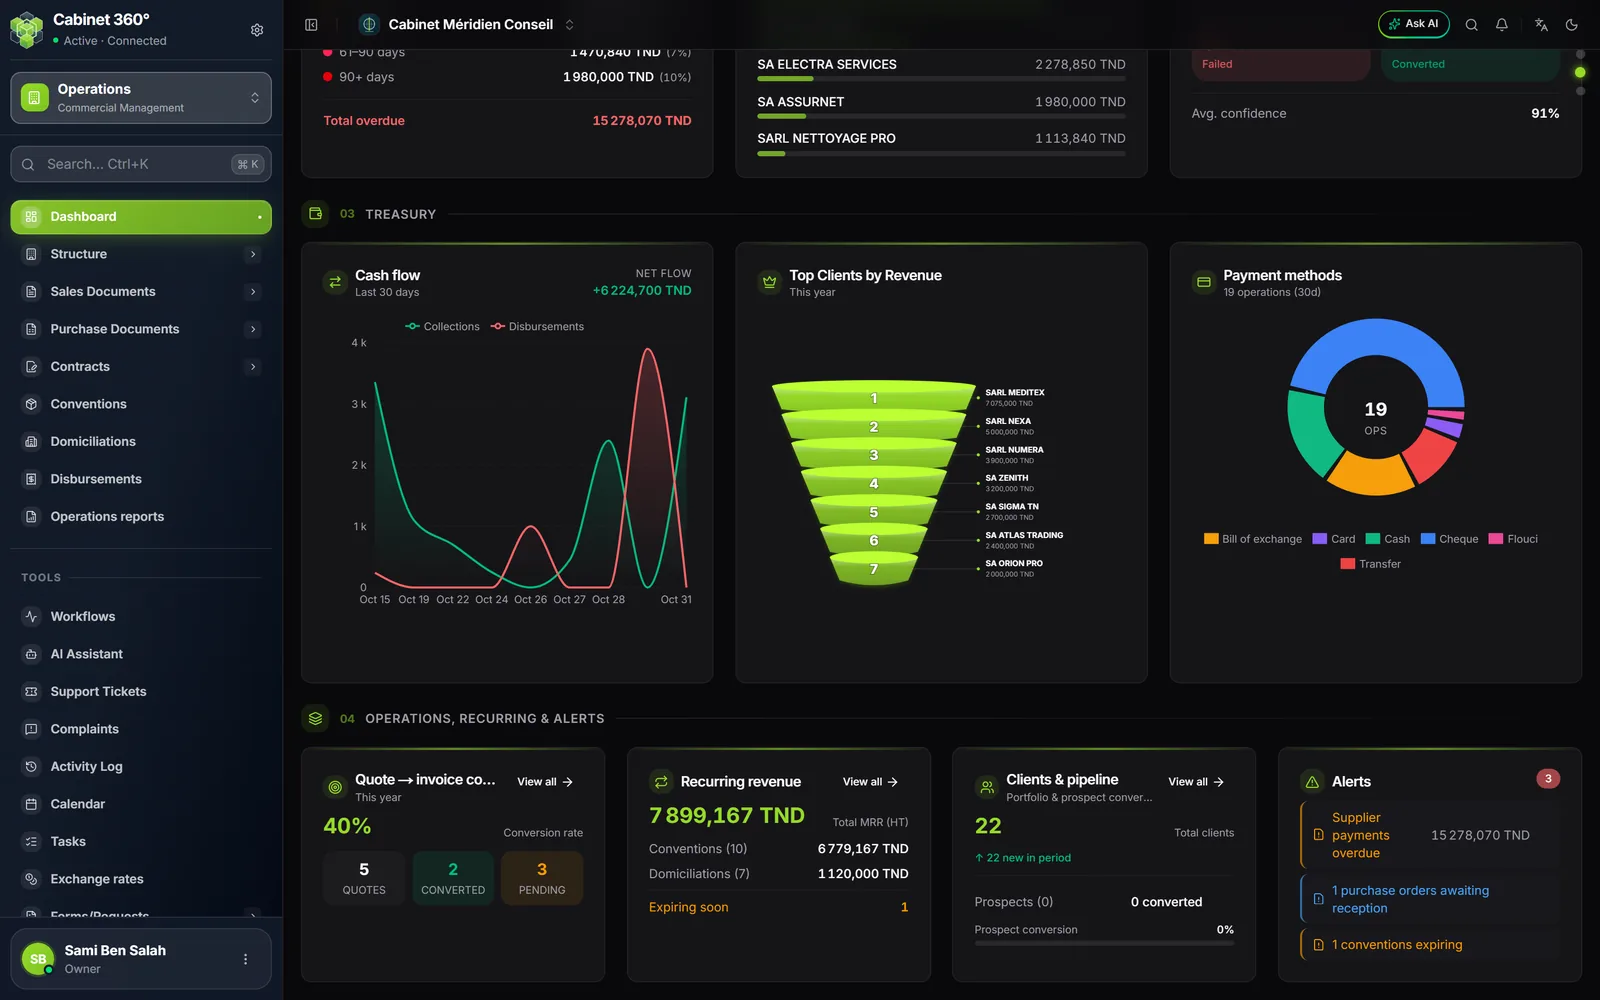
- Cash flow: collections and disbursements day by day.
- Top Clients by Revenue: your best clients; one click opens the record.
- Payment methods: cash, cheque, transfer, card, bill of exchange…
04 Operations, recurring & alerts
- Quote → invoice conversion: how many quotes became invoices or pre-invoices.
- Recurring revenue: conventions and domiciliations, and those expiring soon.
- Clients & pipeline: your clients, your prospects and their conversion rate.
- Alerts: the list of actions waiting.
The alerts
The Alerts card says “All clear” when nothing is waiting. Otherwise, each line names an action, and one click opens the screen where you do it:
- overdue invoices, and overdue supplier payments;
- conventions or domiciliations that are expiring;
- articles low in stock or out of stock;
- OCR extractions to review;
- pre-invoices to bill;
- purchase orders awaiting reception.
An empty page?
In a new company, the page shows “Welcome — let's get started” and three buttons: Add a client, New invoice, Import data. The figures appear as soon as you have your first client or your first invoice.