The DCF file at a glance
The file has thirty sections. This chapter covers the dashboard, DCF settings, Historical data, Business plan and Free cash flow. Chapter 8 goes from the cost of capital to the report.
The top bar shows the client, the engagement, the reference date and the Scénario (Scenario) you are working on. On the right: the WACC, the Enterprise Value, the Equity Value and the file's version.
The file's dashboard
It brings together the engagement's identity (client, valuation date, last historical year, currency, scenario), the file's progress and eight cards: CA dernier exercice (Revenue, last year), FCFF terminal (Terminal FCFF), WACC (validated or not), Valeur terminale (Terminal value, and its share of the Enterprise Value), Enterprise Value, Dette nette (Net debt), Equity Value and Dossier (File: « Prêt », Ready, or « Non prêt », Not ready).
The Prochaine action recommandée (Recommended next action) card names the first point to deal with, taken from the file's checks. On a new file, it is usually « Le chiffre d'affaires prévisionnel est nul sur toutes les années. » (Forecast revenue is zero in every year.) Below it, Points d'attention (Points of attention) lists each check that is not met, with its message.
DCF settings
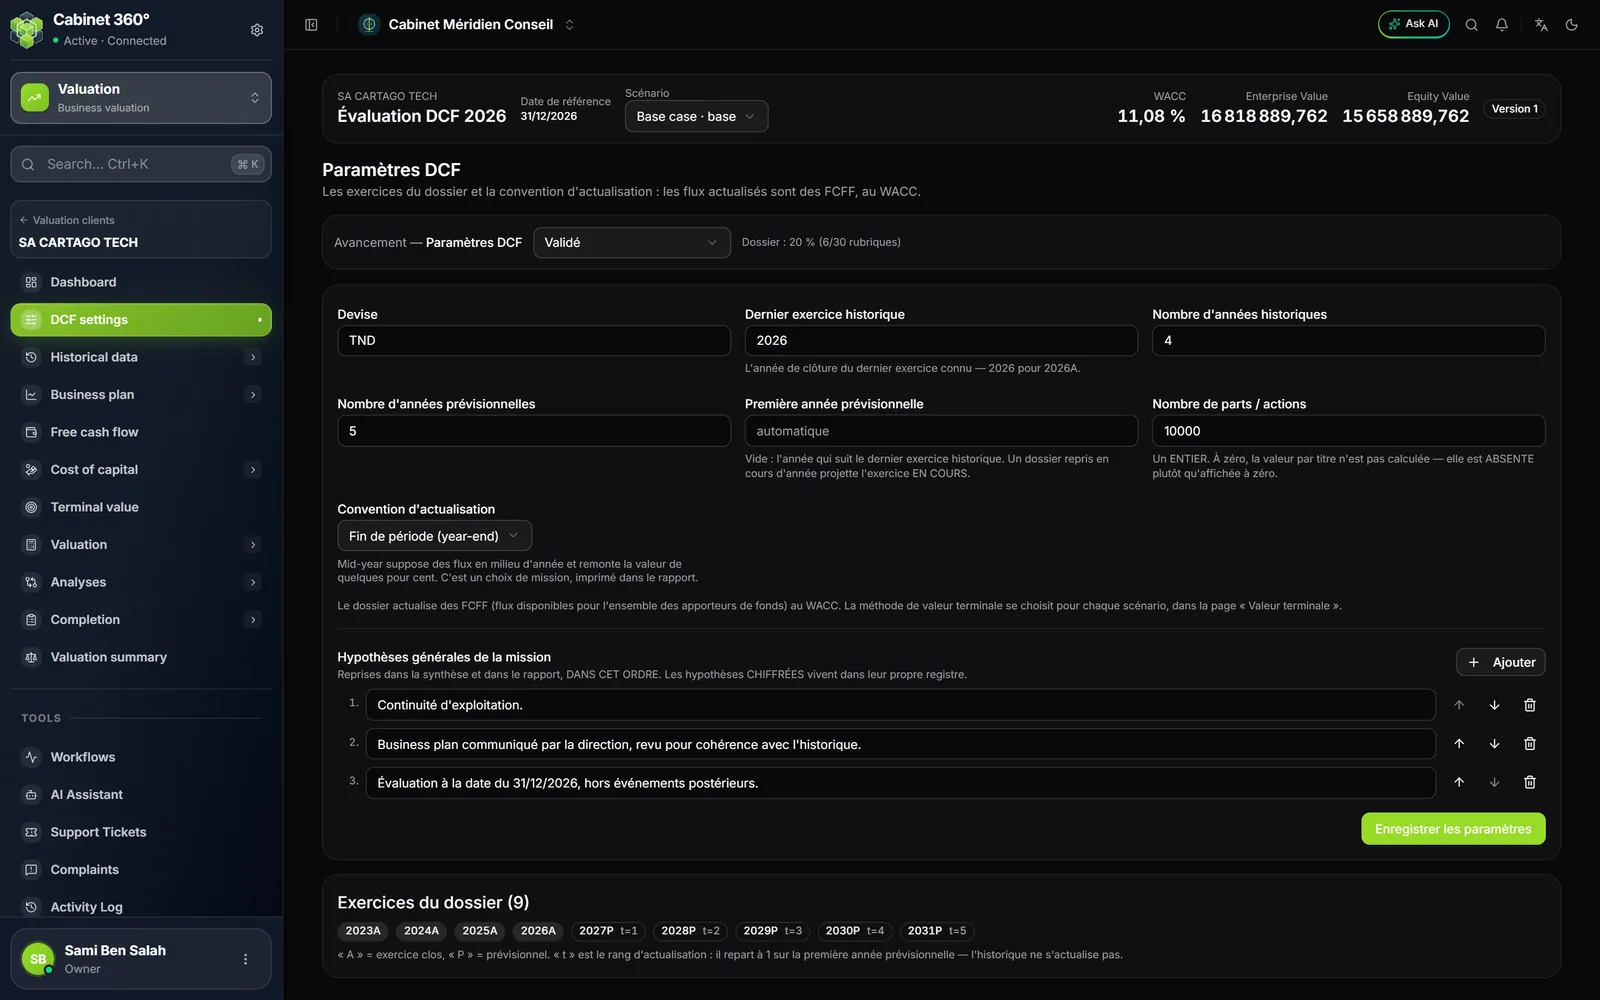
| Field | Default | What it sets |
|---|---|---|
| Devise (Currency) | The engagement's currency | The currency of the file's amounts |
| Dernier exercice historique (Last historical year) | The year of the reference date | The last known year, « 2026 » for 2026A |
| Nombre d'années historiques (Number of historical years) | 4 | The closed years to enter |
| Nombre d'années prévisionnelles (Number of forecast years) | 5 | The plan's horizon |
| Première année prévisionnelle (First forecast year) | Empty (automatic) | Empty: the year after the last historical year |
| Nombre de parts / actions (Number of shares) | 0 | A whole number; at zero, the value per share is not computed |
| Convention d'actualisation (Discounting convention) | Fin de période (year-end) | Or Milieu de période (mid-year), which assumes cash flows in the middle of the year |
Below, Hypothèses générales de la mission (General assumptions of the engagement): click Ajouter (Add), write one sentence per assumption (« Going concern. »), sort them with the arrows. They go into the report's conclusion, in that order.
Click Enregistrer les paramètres (Save settings). The page switches to reading mode; Modifier (Edit) reopens it. The Exercices du dossier (The file's years) card shows the years: « A » for a closed year, « P » for a forecast year, and « t », the discounting rank, which starts again at 1 on the first forecast year.
The file discounts the free cash flows to all providers of funds (FCFF), at the WACC. The terminal value method is chosen on the Terminal value page, for each scenario.
Historical data
Financial data
The « Données financières historiques » (Historical financial data) page shows three tables, one closed year per column:
| Table | Items entered | Computed lines |
|---|---|---|
| Compte de résultat (Income statement) | Chiffre d'affaires (revenue), Coût des ventes (cost of sales), Charges de personnel (staff costs), Autres charges opérationnelles (other operating costs), Dotations aux amortissements (depreciation charges), Résultat financier (financial result), Impôt sur les bénéfices (income tax) | Marge brute (gross margin), EBITDA, EBIT, Résultat avant impôt (profit before tax), Résultat net (net income) |
| Bilan (Balance sheet) | Immobilisations (fixed assets), Stocks (inventory), Clients (trade receivables), Autres créances (other receivables), Trésorerie (cash), Capitaux propres (equity), Fournisseurs (trade payables), Autres dettes opérationnelles (other operating liabilities), Dettes financières (financial debt) | BFR (working capital), Dette nette (net debt) |
| Tableau de flux (Cash flow statement) | CAPEX, Amortissements (depreciation), Variation du BFR (change in working capital) | — |
- Type the amounts. Costs are entered as positive figures.
- A changed box gets an outline, and the banner counts the boxes waiting to be saved.
- Click Enregistrer (Save): the whole grid goes in one block. Nothing is written before.
A box you empty deletes its line: a missing item is not an item at zero. The history applies to every scenario.
Historical analysis
The page computes each year's ratios: growth and margins, working capital and working capital / revenue, customer (DSO), inventory (DIO) and supplier (DPO) periods, CAPEX / revenue, net debt / EBITDA, ROIC. A ratio that cannot be computed shows « — », never zero. Four cards sum up: CAGR du chiffre d'affaires (Revenue CAGR), Marge EBITDA — dernier exercice (EBITDA margin — last year), BFR / CA — dernier exercice (Working capital / revenue — last year), Dette nette / EBITDA (Net debt / EBITDA).
Write the Conclusion de l'analyse historique (Conclusion of the historical analysis) and the Points d'attention, then click Enregistrer l'analyse (Save the analysis). The conclusion opens the report's « Lecture générale » (General reading); the points of attention join its « Réserves et limites » (Reservations and limits).
Business plan
Assumptions
The « Registre des hypothèses » (Assumptions register) page keeps track of each assumption: its category (Croissance (growth), Prix (price), Volumes, Marché (market), Inflation, Salaires (salaries), Marges (margins), BFR (working capital), CAPEX, Fiscalité (tax), WACC, Valeur terminale (terminal value), Autres (other)), its value and unit, the year concerned, its Source and its Justification.
Click Ajouter une hypothèse (Add an assumption), fill in the window, then Enregistrer. The Valider (Validate) icon belongs to the engagement manager or the firm's management, and validation requires a written justification. A banner counts the assumptions without a source or without a justification.
No calculation reads this register: the figures are entered in the following pages. The report prints it as an appendix, for the printed scenario.
Revenue
- Click Ajouter un segment (Add a segment): Code (letters, digits and hyphens), Libellé (Label), Type de segment (Segment type) and CA de référence (dernier historique) (Reference revenue, last historical year).
- In the « Projection du chiffre d'affaires » (Revenue projection) table, choose the method for each forecast year: Saisie directe (Direct entry), Croissance N−1 (Growth on N−1) or Volume × Prix (Volume × Price).
- Type the amount, the growth rate in points (5 for 5%) or the volume and the price. The computed amount shows below.
Growth starts from the segment's reference revenue, then carries on from year to year, provided you enter every year: a year left empty counts as zero, even if its box shows « Croissance N−1 », and the following year starts again from the reference revenue. Segments apply to every scenario; only the projections change from one scenario to another.
Operating costs
Click Ajouter une charge (Add a cost): Code, Libellé, Catégorie (Category: Achats (purchases), Matières (materials), Personnel (staff), Loyer (rent), Énergie (energy), Transport, Marketing, Informatique (IT), Maintenance, Honoraires (fees), Sous-traitance (subcontracting), Autres (other)) and Montant de référence (dernier historique) (Reference amount, last historical year). For each year, choose Montant direct (Direct amount), % du CA (% of revenue; the default choice), Croissance N−1 or Indexation inflation (Inflation indexing), then type the value.
EBITDA / EBIT
Nothing is entered here. The table goes from revenue to EBITDA (revenue minus cash costs), then to EBIT (EBITDA minus depreciation), with their margins. To correct EBITDA, go back to revenue or costs; for EBIT, to depreciation.
Tax
For each forecast year, type the Taux d'impôt (%) (Tax rate, %), in points. The page computes the Impôt normatif sur EBIT (Notional tax on EBIT) and NOPAT = EBIT × (1 − T). The Ajustements fiscaux (Tax adjustments) line is for reference: it does not enter NOPAT. The Source et justification du taux (Source and justification of the rate) card takes the source of each year.
Working capital
For each year, choose the Méthode de projection (Projection method):
| Method | What you enter |
|---|---|
| % du CA (default) | Working capital as a percentage of revenue |
| Rotations (DSO/DIO/DPO) (Turnover periods) | Customer, inventory and supplier periods, in days |
| Détail des postes (Item detail) | Inventory, trade receivables, other assets, trade payables, other liabilities |
| Valeur directe (Direct value) | The working capital amount |
The page computes the BFR (Working capital) and its Variation du BFR (Change in working capital): an increase consumes cash. The first change is measured against the closing working capital of the last historical year, shown at the top of the page.
Capital expenditure
Click Ajouter un investissement (Add an investment): Exercice (Year), Catégorie (Maintenance, Renouvellement (renewal), Croissance (growth), Immobilier (property), Machines, Véhicules (vehicles), IT, Autres (other)), Libellé, Montant (Amount), Source and Justification. The table totals by category, with CAPEX / CA (CAPEX / revenue). A line cannot be edited: delete it and enter it again.
Depreciation & amortisation
For each year: Dotations sur actifs existants (Depreciation on existing assets) and Dotations sur nouveaux CAPEX (Depreciation on new CAPEX). The Total D&A retenu (Retained total D&A) adds them up. Total forcé (dérogation) (Forced total, override) replaces the calculation as long as it is filled in; empty it to go back to the calculation.
Free cash flow
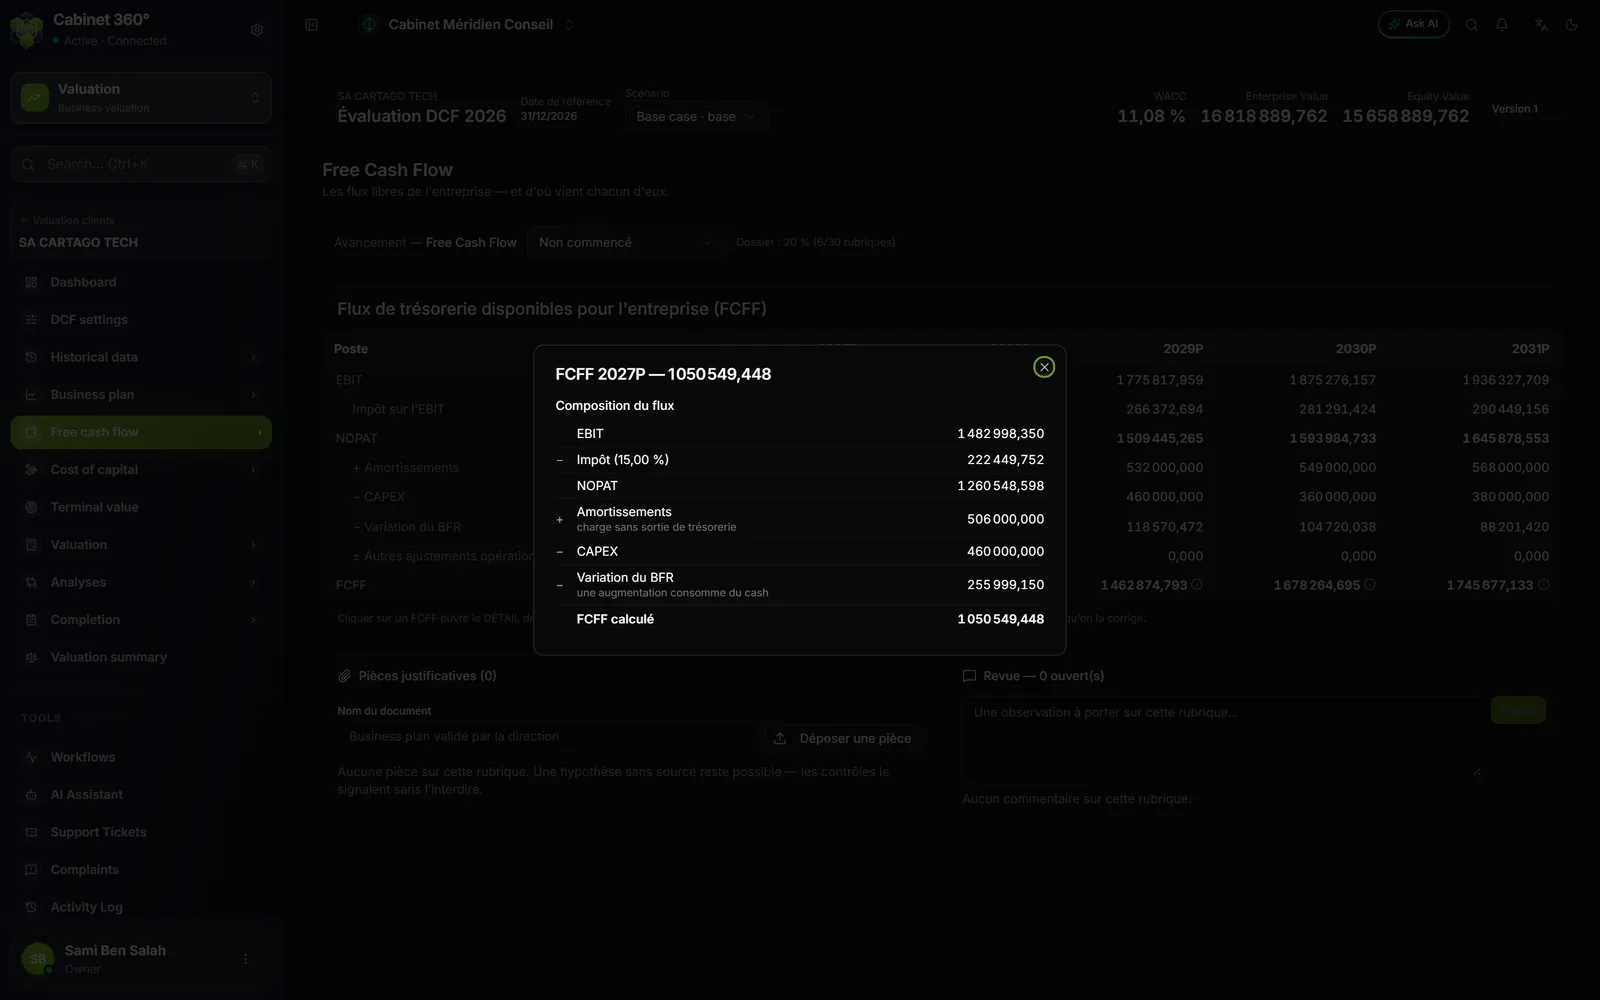
The « Free Cash Flow » page is not entered by hand. It brings the plan together into one cash flow per year:
| Line | Where it comes from |
|---|---|
| EBIT | EBITDA / EBIT |
| Impôt sur l'EBIT (Tax on EBIT) | Tax |
| NOPAT | EBIT minus tax |
| + Amortissements (+ Depreciation) | Depreciation & amortisation |
| − CAPEX | Capital expenditure |
| − Variation du BFR (− Change in working capital) | Working capital |
| ± Autres ajustements opérationnels (± Other operating adjustments) | Always zero today: no screen fills it in |
| FCFF | NOPAT + depreciation − CAPEX − change in working capital |
Click an FCFF: the « Composition du flux » (Cash flow breakdown) window details its calculation, line by line. It answers the question « where does this cash flow come from? ».