
The Analytics page
The CRM analytics page (« Sales performance at a glance ») opens on the last 90 days and on All pipelines.
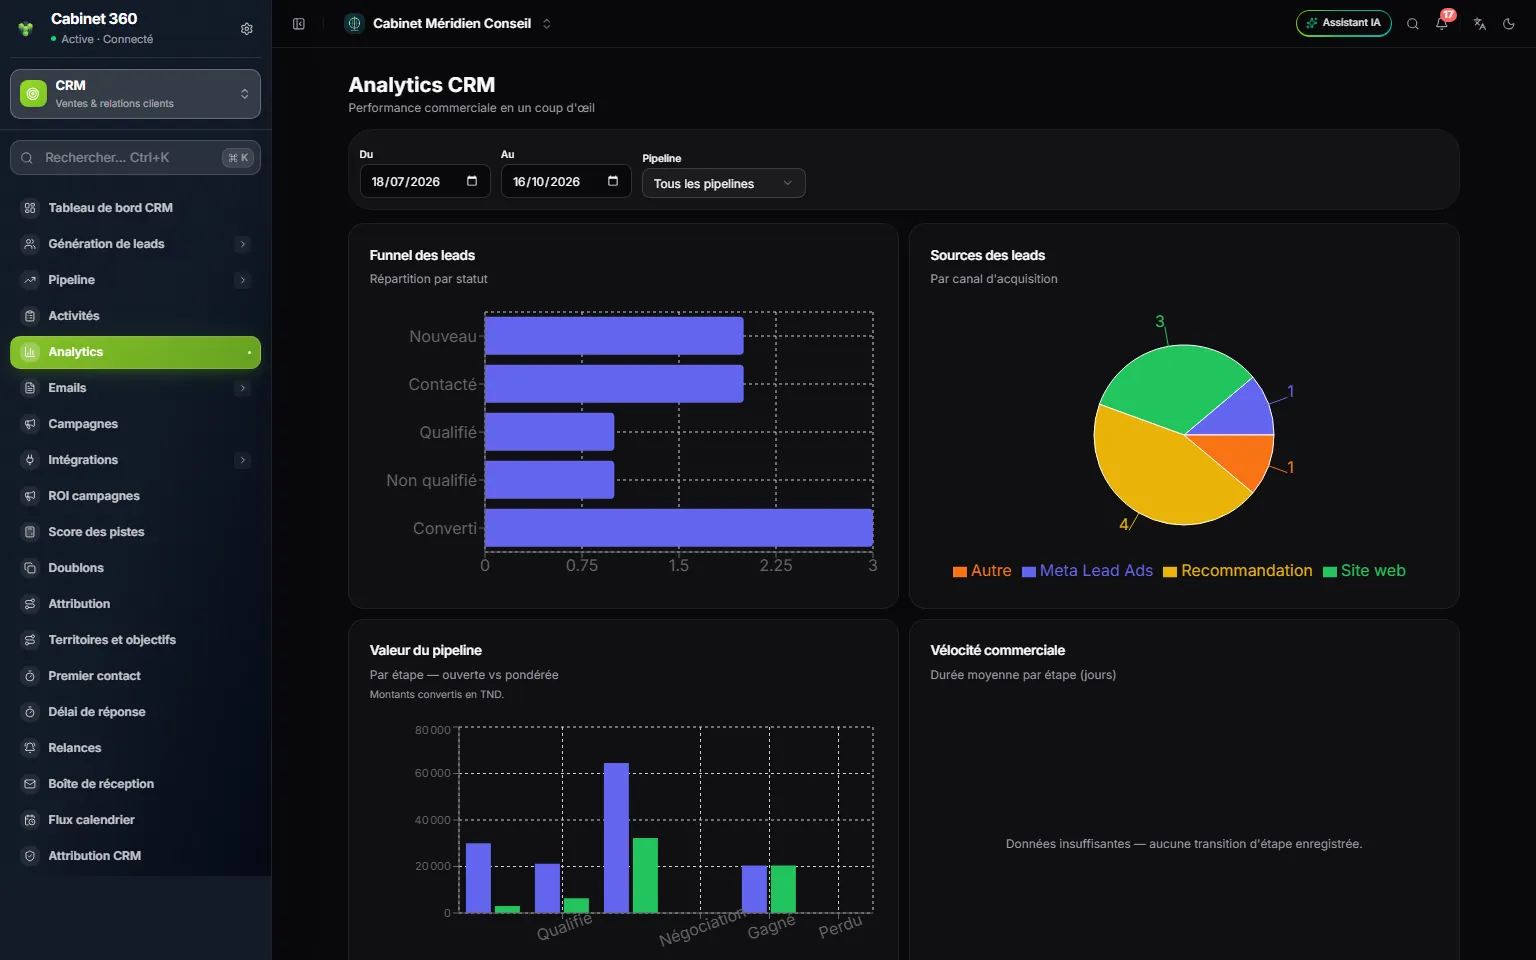
- 1. From and To: the period, prefilled with the last 90 days.
- 2. Lead funnel: your leads by status.
- 3. Lead sources: by acquisition channel.
- 4. Pipeline value: per stage, the open value and the weighted value.
- 5. Sales velocity: the average number of days spent at each stage.
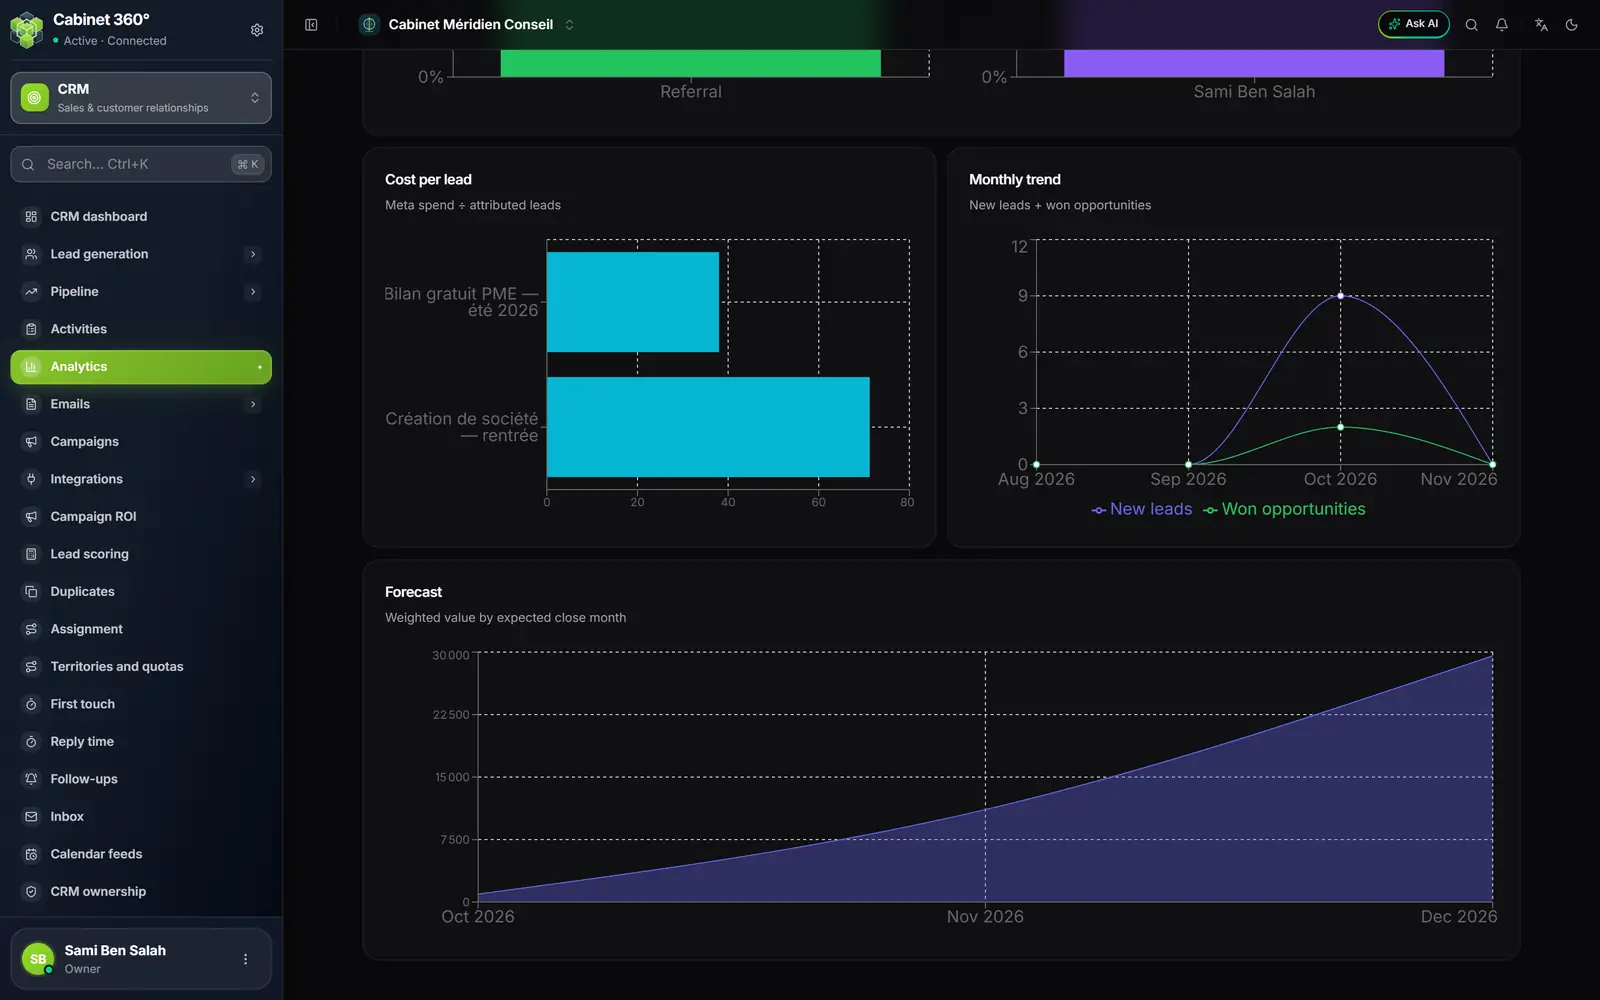
- 1. Cost per lead: the Meta spend divided by the number of leads reported by Meta, campaign by campaign.
- 2. Monthly trend: new leads and won opportunities, month by month.
- 3. Forecast: the weighted value of the deals, by expected close month.
| Block | What it shows |
|---|---|
| Lead funnel | How many leads at each status: New, Contacted, Qualified, Unqualified, Converted. |
| Lead sources | Where your leads come from: Website, Referral, Meta Lead Ads… |
| Pipeline value | For each stage, the Open value (the amount of the deals) and the Weighted value (that amount multiplied by the stage's probability). |
| Sales velocity | The average number of days spent at each stage. |
| Win rate | The won deals out of the closed deals (won or lost): overall, by source and by rep. |
| Cost per lead | For your 20 Meta campaigns that spent the most: the spend divided by the number of leads reported by Meta. |
| Monthly trend | The new leads and the won opportunities, month by month. |
| Forecast | The weighted value of the open deals, sorted by expected close month. |
The figures only count what you are allowed to see: if visibility is limited to the owner (chapter 2), each salesperson reads their own results, except the velocity and the cost per lead, which are calculated over the whole firm.
Three messages can replace an empty block:
- « Not enough data — no stage transitions recorded yet. »: the velocity is calculated on the moves from one stage to another; with no move, there is nothing to measure.
- « Connect Meta Ads to see cost per lead. »: this block reads the spend of your Meta ads (chapter 4).
- « No opportunities with an expected close date. »: the forecast needs an expected close date on your deals.
Without the « revenue-reports » permission, the last two messages also show: they then mean nothing. « Connect Meta Ads… » also appears when Meta is connected but has spent nothing over the period.
First touch
The First recorded touch report measures the time between the creation of a lead and the first recorded contact activity: call, meeting, email (including one sent from the CRM), SMS, WhatsApp or Meta message. A note or a task does not count. Over the chosen period (90 days at the start), it gives:
- Leads, Touched, Untouched and the Touch rate;
- the Median, the Average, the Fastest and the Slowest delay;
- the Distribution of the delays: under 1 hour, 1 to 4 hours, 4 to 24 hours, 1 to 3 days, 3 to 7 days, over 7 days;
- the same delay By source and By owner.
Reply time
The Reply time report measures the time between an email sent by the CRM and the recipient's first genuine reply, in the same thread. Choose the window: the last 30, 60, 90, 180 or 365 days (90 at the start). It gives the Replies measured, the Reply rate, the Median, the Average, the Sends unanswered and the Distribution by delay range.
Only emails count: calls and meetings are not included. Automatic replies recognised by their subject (out of office, automatic reply, non-delivery notice) are set aside.
The inbox
The Inbox gathers the replies received to your CRM emails, sorted by conversation thread. It is read-only: you do not write from it. It stays empty as long as inbound email is not set up for your firm. It is open to anyone who can read leads: what a lead writes is read with their record.
Frequently asked questions
Why do my figures differ from those of the dashboard?
The dashboard counts everything, with no period. Analytics bounds the lead blocks to the From / To period.
Can I export these reports?
No, these pages are viewed on screen. To work on the figures in Excel, export the lists of leads or of opportunities (chapters 3 and 6).