
Generate, then recalculate
The first time, the page says "No analysis saved for this year." and offers Generate the ratios. Afterwards, the button is called Recalculate. It is the same action: IntegraSys reads the file's financial statements (chapter 4) and the additional information (chapter 5) again, computes the ratios, their status, the score and the risk, then saves the analysis. There is no separate "Save" button.
The message « Ratios calculés » (ratios computed) gives the score and the number of ratios analysed, for example « Score 89/100 — 31 ratios analysés. »
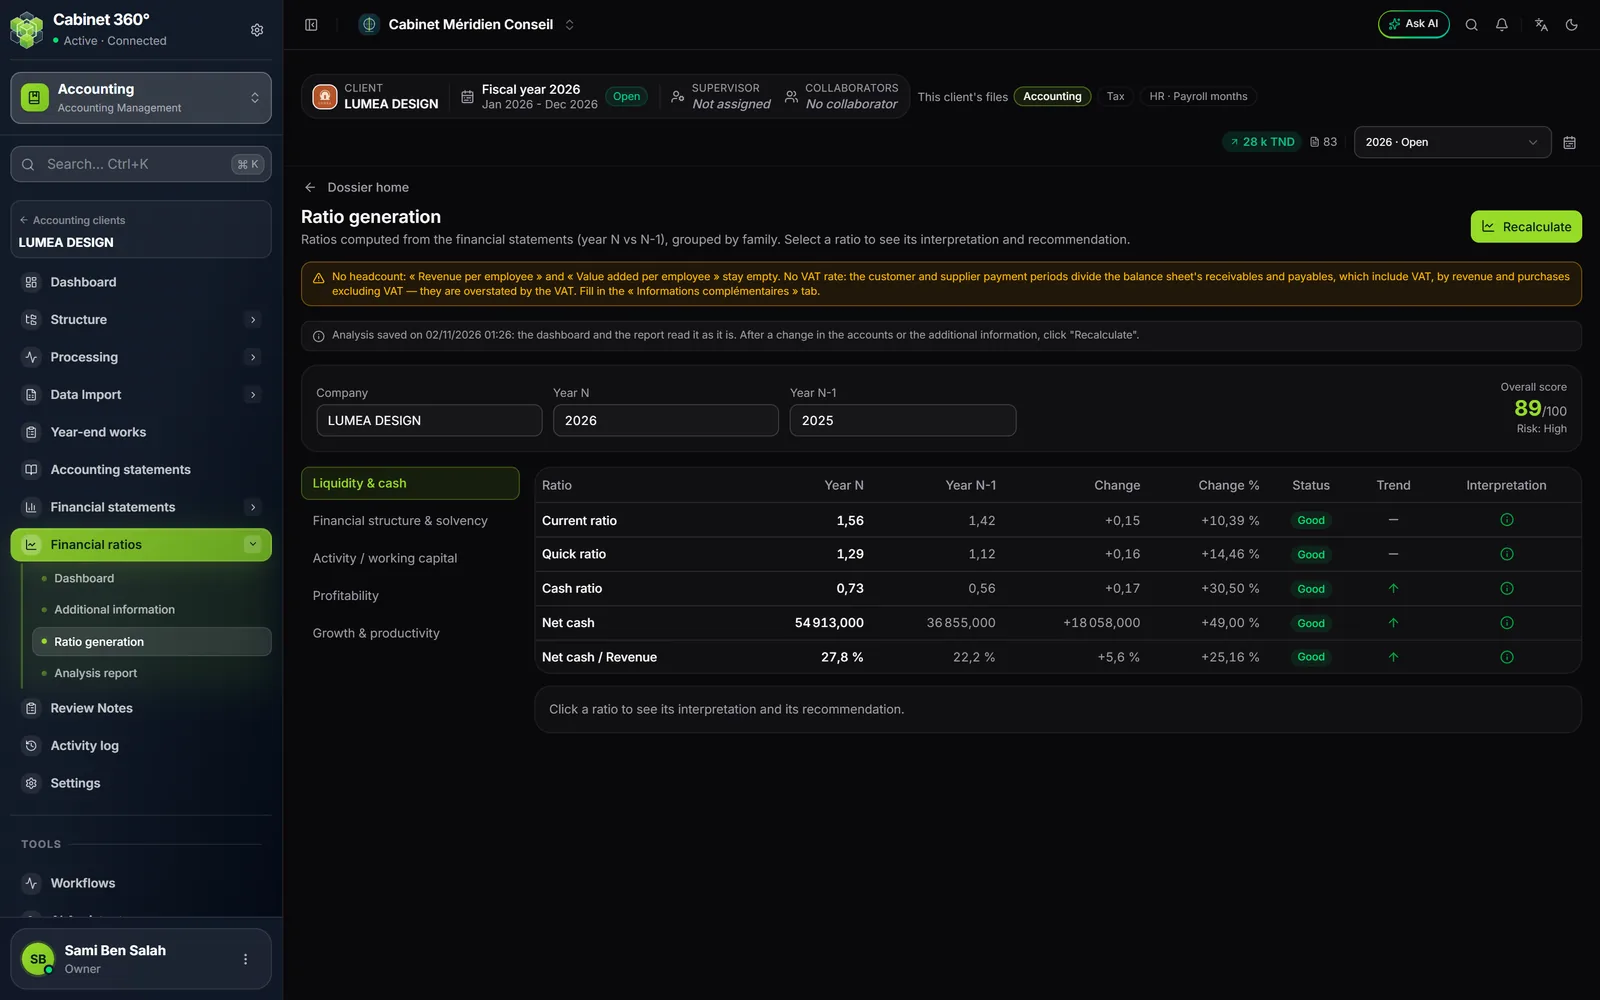
- 1. Recalculate: recalculates and saves the analysis in one go.
- 2. The warning: what an empty VAT rate or headcount changes.
- 3. Analysis saved on …: the date of the analysis that the dashboard and the report read.
- 4. Overall score out of 100 and Risk.
- 5. The families: click a family to show its ratios.
- 6. Status and Trend of each ratio; the interpretation icon takes the colour of the status.
- 7. Click a row: its interpretation and its recommendation appear here.
The missing-information warning
When the VAT rate or the headcount is not entered for the year, an orange banner says so, with what it changes:
- "No VAT rate: the customer and supplier payment periods divide the balance sheet's receivables and payables, which include VAT, by revenue and purchases excluding VAT — they are overstated by the VAT."
- "No headcount: « Revenue per employee » and « Value added per employee » stay empty."
The banner ends with "Fill in the « Informations complémentaires » tab." — the Additional information screen. It is advice, not a block: the calculation runs without this information.
The top of the page
- The line "Analysis saved on 02/11/2026 01:26: the dashboard and the report read it as it is." tells you when the analysis dates from.
- Company, Year N and Year N-1 recall the client, the year of the fiscal year and the year before (shown even when the previous fiscal year does not exist).
- On the right, the Overall score out of 100 and the Risk: high, medium or low (chapter 7).
The families and the ratio table
On the left, the families of the analysis: Liquidity & cash, Financial structure & solvency, Activity / working capital, Profitability, Growth & productivity, and Third-party analysis if its ratios are active. Click a family: the table shows its ratios.
| Column | What it gives |
|---|---|
| Ratio | The ratio's name. |
| Year N | Its value for the chosen year, in its unit: a number (1,56), a percentage (27,8 %), an amount in dinars (54 913,000) or days (45 j). |
| Year N-1 | Its value for the previous year; "—" with no previous year. |
| Change | The year minus the previous year, in the ratio's unit. |
| Change % | The change divided by the previous year's value taken without its sign: a fall stays a fall, even when the ratio is negative. |
| Status | Good, To watch or Critical, according to the ratio's thresholds. |
| Trend | Whether the change goes the right way. |
| Interpretation | An icon in the colour of the status; hover over it to read the interpretation. |
Reading the trend
The trend does not say whether the ratio rises or falls: it says whether its change is favourable.
- Green arrow pointing up: the change is favourable. For a ratio where "higher" is favourable (the cash ratio), it rose; for a ratio where "lower" is favourable (the overall debt ratio), it fell.
- Red arrow pointing down: the change is unfavourable.
- Dash: the ratio did not move, has no value for the previous year, or has no favourable direction. This is the case of the current ratio, the quick ratio and the supplier payment period, whose right level is a balance.
Interpretation and recommendation
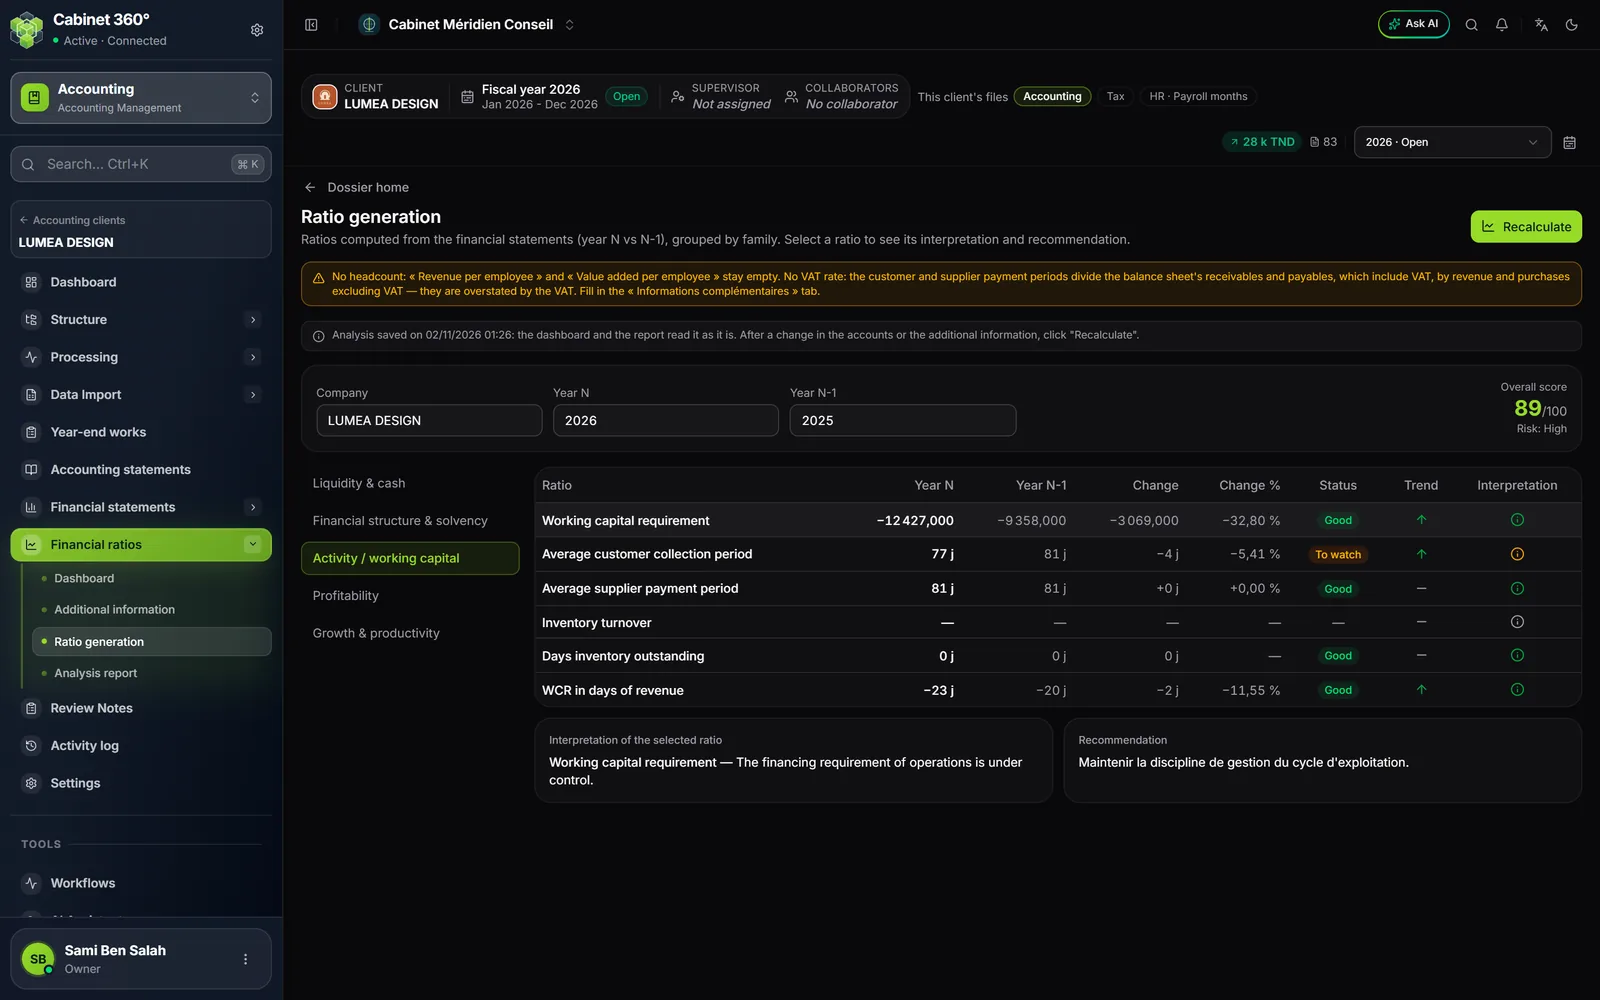
Click a row of the table. Two boxes appear below it:
- Interpretation of the selected ratio: what the value means, according to the status, for example, for an overall debt ratio to watch, "Debt is significant and must be kept under control.";
- Recommendation: what to do, for example "Track changes in debt and limit new commitments."
These texts come from the ratio catalogue, one per status. The dashboard and the report use them too. For a ratio with the Good status, the recommendation is shown in French on an English screen.
When the calculation is refused
The message « Échec du calcul des ratios. » (ratio calculation failed) gives the server's reason, in French:
| Reason | What to do |
|---|---|
| « Données indisponibles pour cet exercice. » (no data for this year) | The year has no amount: check that it has entries, or choose another year. |
| « Aucun modèle d'états financiers n'est associé au dossier comptable… » (no financial statements template) | Choose the FS template and the Template type in the client's accounting file. |
| A rights refusal | You need the Create right on the ratio screens. |