The empty dashboard
As long as no analysis is saved for the year, the page shows "No saved analysis" and "No ratios have been computed for this fiscal year yet. Generate them from the accounting financial statements."
The Generate the ratios button does exactly what the one in Ratio generation does: it computes and saves the analysis. The message « Ratios calculés » (ratios computed) then gives the score and the number of ratios analysed.
Reading the dashboard
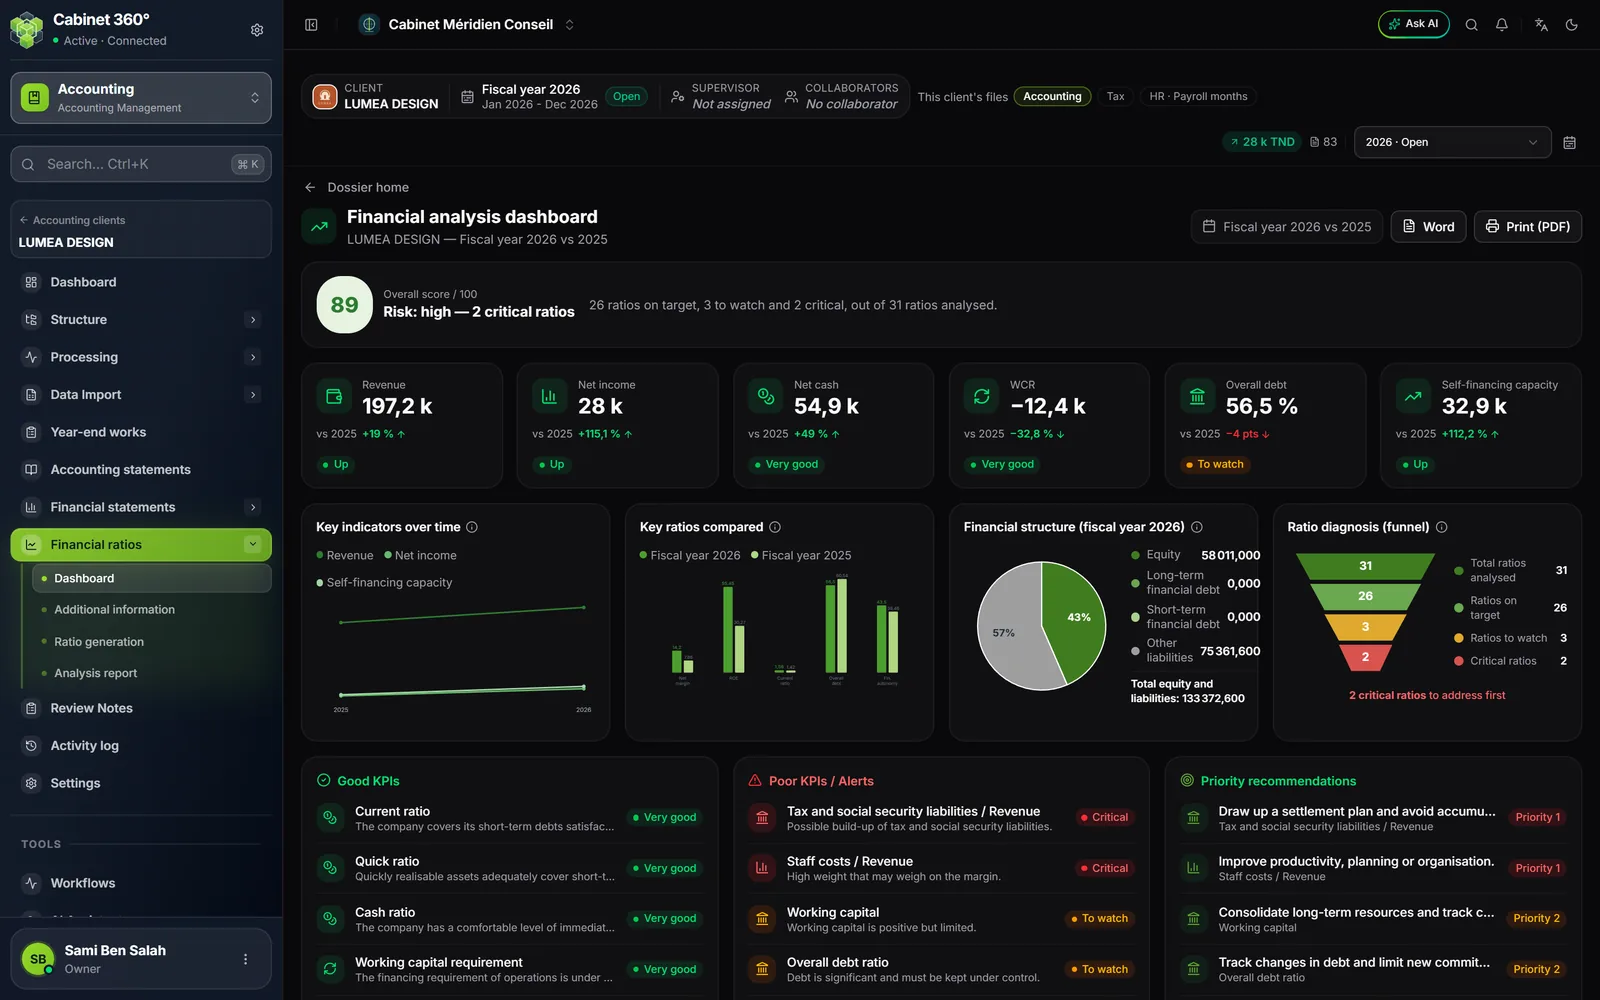
The page is titled "Financial analysis dashboard". Under the title: the client's name and "Fiscal year 2026 vs 2025", the chosen year and the previous one.
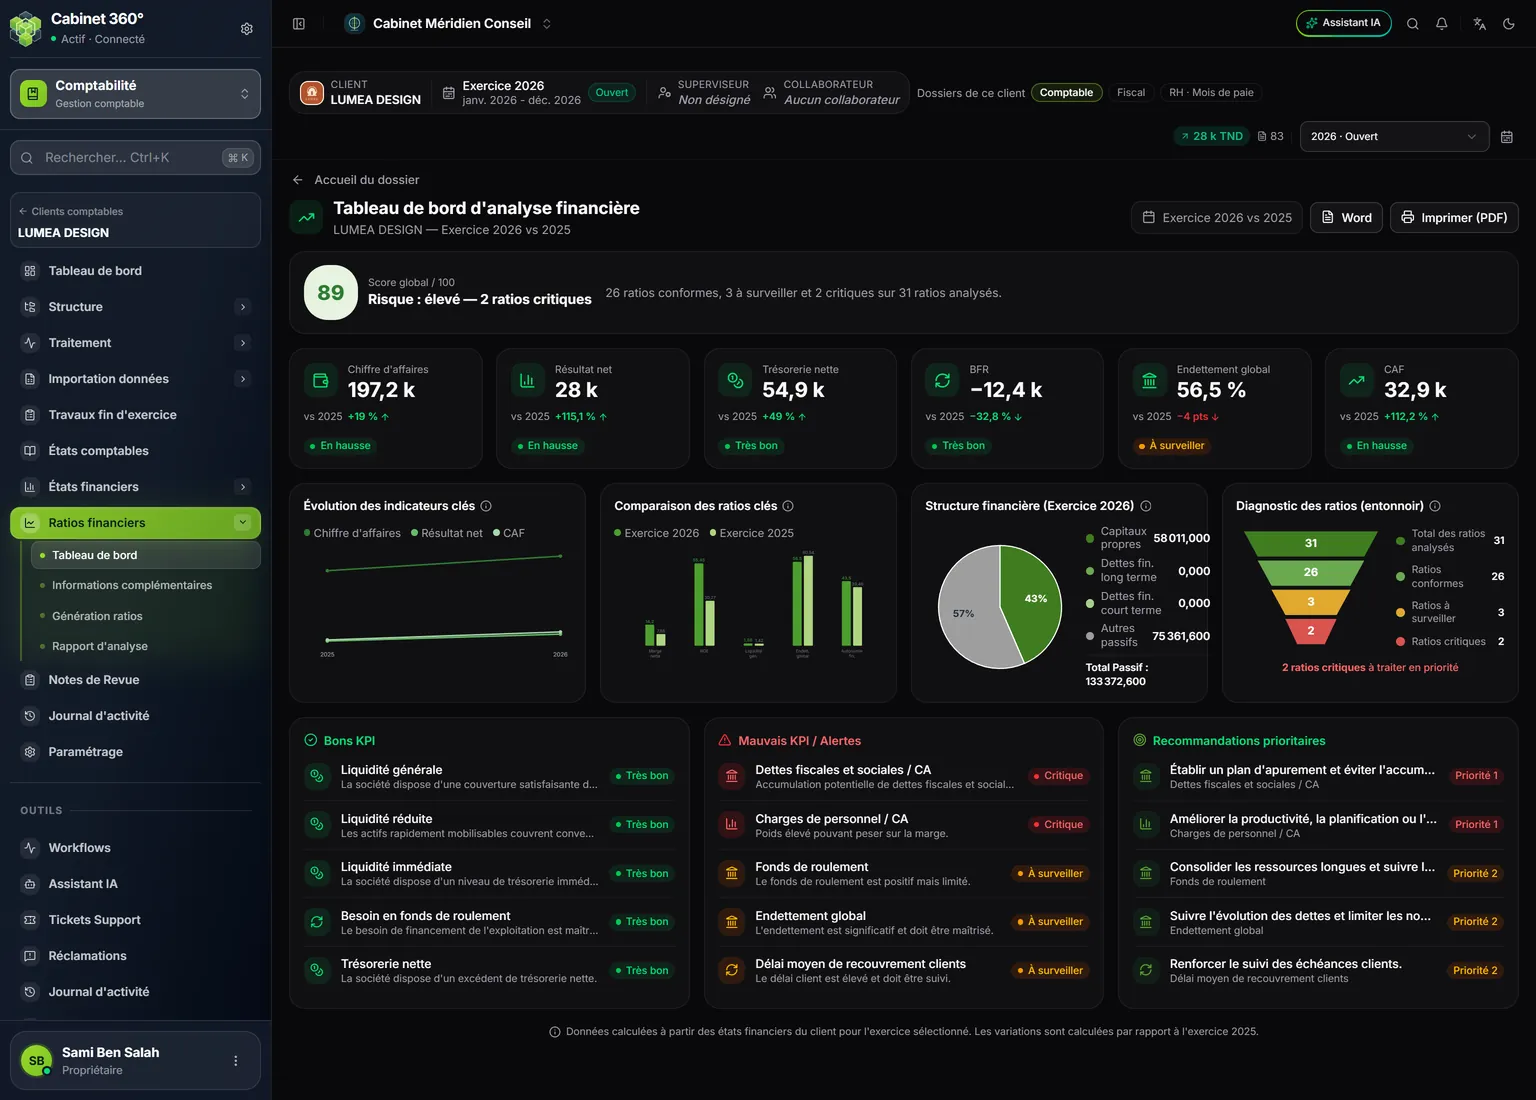
- 1. Overall score / 100 and, below, the risk, with its reason when it is high: "Risk: high — 2 critical ratios". On the right, the ratio count.
- 2. Six cards: revenue, net income, net cash, WCR, overall debt, self-financing capacity, each compared with the previous year.
- 3. Four charts: key indicators over time, key ratios compared, financial structure, ratio diagnosis.
- 4. Good KPIs: the ratios with the Very good status.
- 5. Poor KPIs / Alerts: critical ratios, then ratios to watch.
- 6. Priority recommendations: Priority 1 for a critical ratio, Priority 2 for a ratio to watch.
- 7. Word and Print (PDF): to take this page out on its own.
The score and the risk
The score sums up how the computed ratios are spread: a Good ratio counts for 100, a To watch ratio for 50, a Critical ratio for 0. The score is the average, rounded. Its badge is green from 70, orange from 50 to 69, red below 50.
The risk is not read from the score. It is:
- high as soon as a single ratio is critical, even with a good score;
- medium when there are more ratios to watch than good ones;
- low otherwise.
The line under the score says it. When the risk is high, it gives the reason: "Risk: high — 2 critical ratios"; otherwise it only says "Risk: medium" or "Risk: low". On the right, a sentence counts the ratios: "26 ratios on target, 3 to watch and 2 critical, out of 31 ratios analysed". A ratio that could not be computed, for lack of data, counts neither in the count nor in the score.
The six cards
| Card | Where the figure comes from | What the bottom of the card says |
|---|---|---|
| Revenue | Intermediate management balances | "Up" or "Down" compared with the previous year |
| Net income | Intermediate management balances | "Up" or "Down" |
| Net cash | "Net cash" ratio | The ratio's status |
| WCR | "Working capital requirement" ratio | The ratio's status |
| Overall debt | "Overall debt ratio", in % | The ratio's status; the change is in points (pts) |
| Self-financing capacity | Net income + depreciation, amortisation and provisions | "Up" or "Down" |
Each card gives the change against the previous year ("vs 2025"). On the cards only, here and in the report, amounts are rounded in short notation: "197,2 k" reads about 197 200 dinars, "1,3 M" about 1 300 000 dinars. Everywhere else in the analysis, an amount is written in full.
The four charts
- Key indicators over time: revenue, net income and self-financing capacity, from the previous year to the chosen one.
- Key ratios compared: net margin, ROE, current ratio, overall debt and financial autonomy, both years side by side.
- Financial structure of the year: equity, long-term financial debt, short-term financial debt (bank overdrafts) and other liabilities, with "Total equity and liabilities".
- Ratio diagnosis (funnel): total ratios analysed, on target, to watch, critical. If there are critical ratios, a red line says how many are "to address first".
The three lists at the bottom
| List | What it holds | Order |
|---|---|---|
| Good KPIs | Ratios with the Very good status, with their interpretation | Catalogue order |
| Poor KPIs / Alerts | Critical ratios, then To watch, with their interpretation | From the most serious to the least |
| Priority recommendations | The recommendation of those same ratios, with Priority 1 (critical) or Priority 2 (to watch) | From the most serious to the least |
Each list keeps five ratios at most. A critical ratio always comes before a ratio to watch: it can never be left out of the five behind less serious ratios. Ratio generation shows them all.
At the bottom of the page, a line recalls that the figures come from the client's financial statements for the chosen year and that the changes are measured against the previous year.
Printing or exporting the dashboard
- Print (PDF) opens the browser's print window, in A4 landscape, without the sidebar. Choose a printer or save as PDF.
- Word downloads the page as a
tableau-de-bord-ratios.docfile.
The dashboard follows the screen language. For the full document to hand to the client, use the report (chapter 8).