MODULE GUIDE
Ratios & Financial Analysis
From the financial statements to the client report
Start reading9 chapters
 IntegraSys ERP2026 edition
MODULE GUIDERatios & Financial AnalysisFrom the financial statements to the client report
Contents
- Chapter 1 — The ratios at a glanceYour client asks how the company is doing. The Financial ratios group of the client's accounting file reads its financial statements, computes its ratios, compares them with the previous year and gives you a report ready to hand over.What the analysis does, and what it never touchesThe four screens of the groupComputing means savingWhat you need before you startThe ratio catalogue in Settings
- Chapter 2 — Opening a client's analysisEverything starts from a client's accounting file and a fiscal year. You open the file, choose the fiscal year in its bar, then unfold Financial ratios in its menu: the four screens of the analysis are there.Opening the client's accounting fileChoosing the fiscal year in the file's barThe Financial ratios group and its four screensThe order the first time
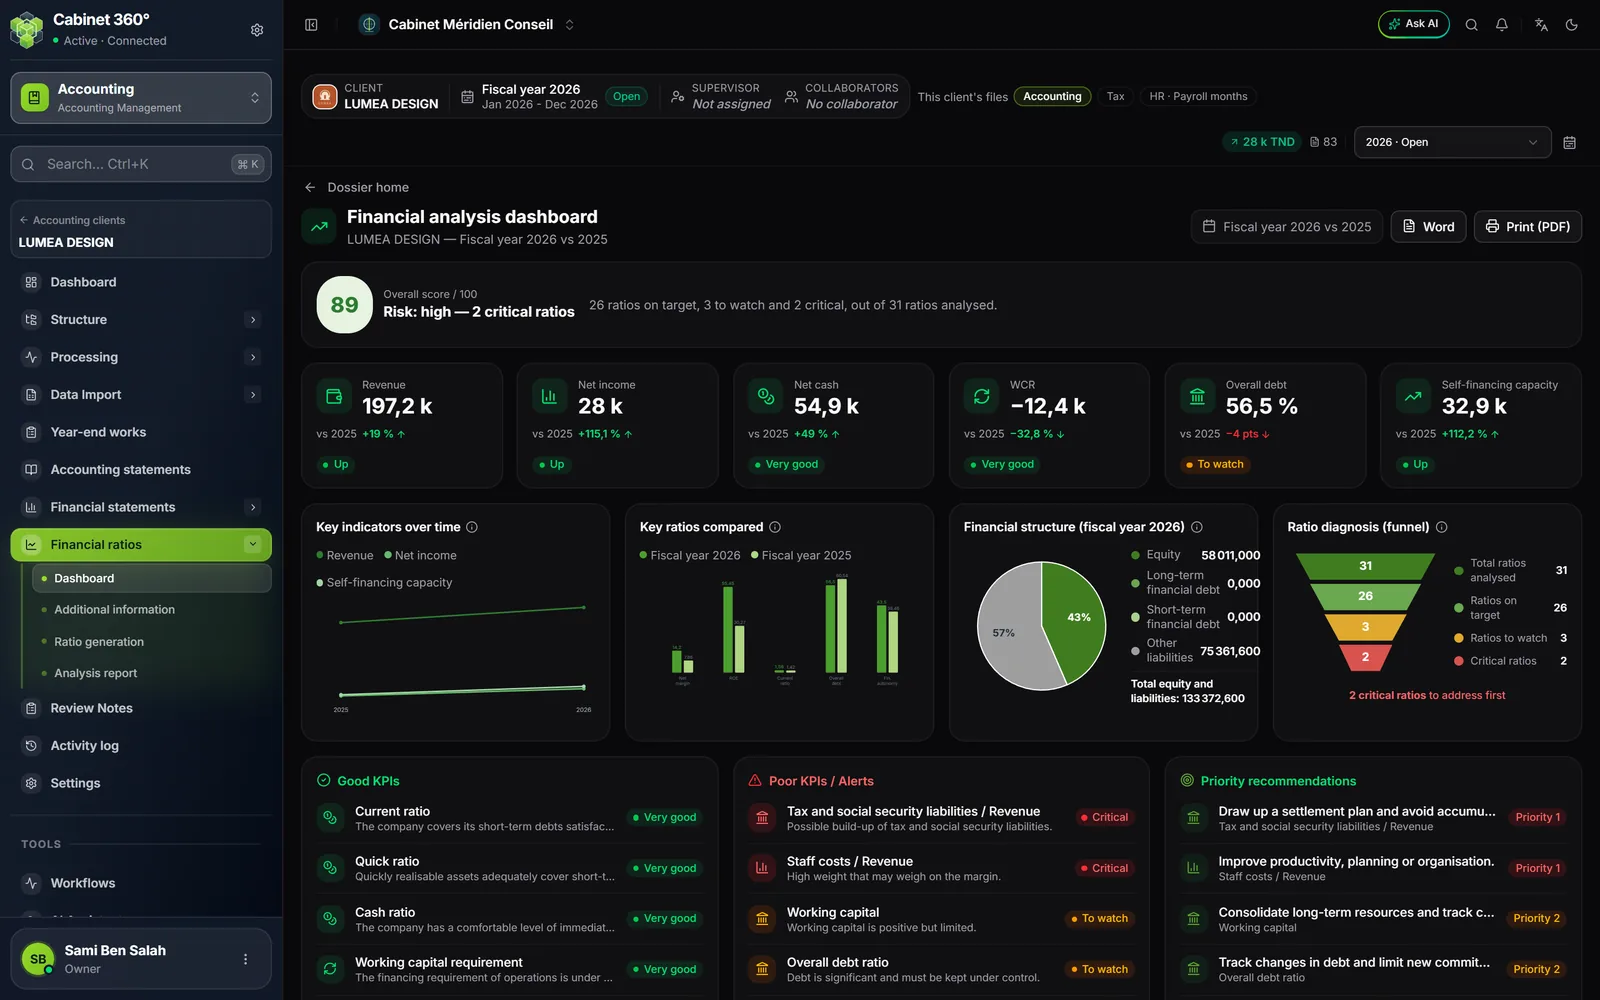
- Chapter 3 — The dashboardOne page to see how the company is doing: a score out of 100, the risk level, six key figures compared with the previous year, four charts and three lists, from the good ratios to the recommendations.Generating the first analysis from the empty dashboardThe score, the risk and the ratio countThe six cards and the four chartsGood KPIs, alerts and priority recommendationsPrinting or exporting the dashboard
- Chapter 4 — The financial statementsThe ratios are computed on the file's financial statements, those that the client's accounting generates. The Financial ratios group keeps no copy of them: you check them in the Financial statements group, correct a figure in the accounting, then recalculate.Where the statements the ratios read are foundWhat the ratios read in each statementCorrecting a figure: in the accounting, then recalculateThe previous yearThe balances adjusted in the former screen
- Chapter 5 — The additional informationSome ratios need figures that the financial statements do not give: the VAT rate, the headcount, a few third-party balance totals. You enter them once per fiscal year. None of them is mandatory.The three blocks and their eight boxesThe VAT rate and the customer and supplier periodsThe headcount and the third-party balance: when they countHow a box is readSaving, then recalculating
- Chapter 6 — Ratio generationThis is where the analysis is computed and saved, and where you read each ratio: its value over both years, its change, its status, its trend, its interpretation and its recommendation.Generate, then recalculateThe missing-information warningThe families and the ratio tableStatus, trend, interpretation and recommendationWhen the calculation is refused
- Chapter 7 — The ratios one by oneKeep this chapter at hand when you explain a result to a client: how a status is born, how the BFR's word thresholds are read, where the score and the risk come from, then every ratio of the standard settings, family by family.How a status is bornThe working capital requirement and its word thresholdsThe score, the risk and the order of the listsThe six families and their ratios
- Chapter 8 — The analysis reportThe report lays the saved analysis out: a cover page in the client's colours, then six to eight A4 pages that go from the summary to the recommendations, with the financial statements and every ratio in the appendix. You review it, then print it as PDF or export it to Word.Before opening the reportThe report's pages, one by oneWhat is read from the analysis, and what stays a standard textPrinting as PDF, exporting to Word
- Chapter 9 — A file from start to finishThe demonstration client LUMEA DESIGN, fiscal year 2026 compared with 2025: you open the file, check, compute, read, complete, recompute and hand over the report. Every figure comes from the screens shown in this book.A complete example, from opening to the reportExplaining the score and the risk to the clientThe one-page memo